50% Trading Volume Drop Signals Major Shift

The price of Shiba Inu (SHIB) has been falling sharply, with average trading volume down 50% over the past two weeks. This indicates a possible shift in investor sentiment towards Shiba Inu. The decrease in trading volume may indicate a recent slowdown in buying, possibly a broader market reevaluation.
Adding to the cautious stance, SHIB's technical indicators, such as the overbought RSI and bearish EMAs, suggest impending corrections. These factors suggest that SHIB may be going through tough times, raising questions about its ability to continue its recent bullish pace.
Average transaction volume is decreasing.
An analysis of SHIB's average transaction volume for the past month prints an interesting scenario. From February 21 to March 6, it increased from $10,139 to $42,491. This represents a growth of 319.08% in two weeks. During the same period, SHIB's value increased from $0.000009 to $0.000034, a growth of 277.78%. As we can see, during the recent bull run, these parameters seem to be correlated.
Then the average transaction volume increased further, and then began to fall sharply. From $49,816 on March 11 to $22,824 on March 21, a decrease of -54.18%. At the same time, SHIB price dropped from $0.000033 to $0.000027, a decrease of -18.18%.
As these two metrics seem to be highly correlated over the past few months, this gap between average trading volume declines and price corrections is likely to close over the next few days, as SHIB prices are likely to decline further.
Read More: Shiba Inu (SHIB) Price Prediction 2024/2025/2030
SHIB RSI is still at the overbought level.
Despite the recent price correction, SHIB's Relative Strength Index (RSI) remains at a high of 81. This shows the carrying capacity. This high RSI level, significantly above the 70 mark, indicates that SHIB may be considered overvalued at the moment. This may set the stage for a downward correction in the price.
Generally, an RSI value above 70 indicates that the asset may be overbought, raising the possibility of an upcoming rebound as the market struggles to find a balance between demand and supply volatility.
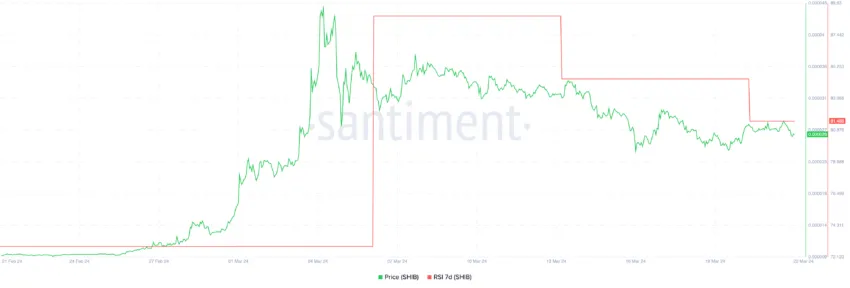
The RSI indicator itself is an important tool in technical analysis as a momentum oscillator that measures the speed and change of price movement in the range of 0 to 100 based on recent price increases and decreases. SHIB's RSI's advance from 88 on March 11 to 81 on March 21, while reflecting a slight reduction in buying momentum, keeps it in uncharacteristically overbought territory.
This situation is commonly interpreted by investors as an indicator of depression, suggesting that the asset has come under intense buying pressure, which may not be sustainable over time. As a result, the expected value of SHIB may decrease, as the market naturally adjusts to these variables, moving closer to its intrinsic value.
SHIB Price Prediction: Will SHIB hold support at $0.000023?
The SHIB Exponential Moving Average (EMA) lines are currently showing an interesting trend in their price action, with the short-term EMA lines approaching a cross below the long-term EMA lines. This potential crossover is a significant technical indicator that suggests bearish momentum may be on the horizon, indicating that the price may decline if the trend continues.
Also, the fact that the AMA lines are very close to each other and connected to the current price line indicates that there is no strong momentum in either direction, which indicates that the market is in a state of uncertainty. When AMA lines hover near the current price, it usually indicates a consolidation phase, where price can move in either direction depending on market sentiment and upcoming developments.
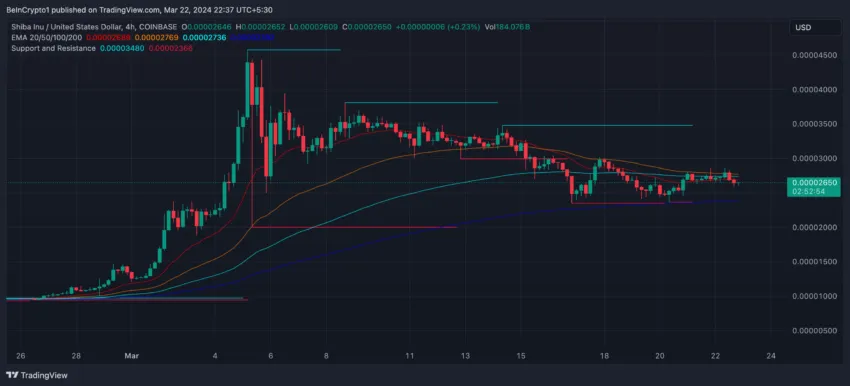
EMA lines give more weight to recent prices, which respond faster to market changes than SMAs. They help identify trend directions and potential reversals. A short-term EMA falling below the long-term suggests a bearish outlook; Going over the top shows the potential for promiscuity.
Read More: 11 Best Shiba Inu (SHIB) Wallets in 2024
SHIB is priced at $0.000026, just above the $0.000023 support. If it breaks, $0.000020 could be next. If the trend reverses, it may challenge the $0.000034 resistance, possibly reaching $0.000038.
Market trends, sentiment and crypto volatility have a significant impact on these factors, highlighting the importance of monitoring these indicators.
Disclaimer
In accordance with Trust Project guidelines, this price analysis article is for informational purposes only and should not be construed as financial or investment advice. BeInCrypto is committed to accurate, unbiased reporting, but market conditions are subject to change without notice. Always do your own research and consult with a professional before making any financial decisions. Please note that our terms and conditions, privacy policies and disclaimers have been updated.


