Are Solana (SOL) bulls at a new high recently?

Solana (SOL) price looks set to start a new bullish cycle, mirroring Bitcoin's recent direction.
This begs the question: Will Solana reach a new all-time high (ATH) soon?
Can Solana Break the Golden Ratio at $170?
Solana is approaching golden ratio resistance at $170, with only a 10.6% gap to bridge. A breakthrough at this critical level could start a new bullish cycle for Solana, which could see it retest its all-time high (ATH) around $260.
Additionally, the Moving Average Convergence Divergence (MACD) histogram shows an upward trend on the monthly chart, with the MACD lines in a bullish cross and the Relative Strength Index (RSI) in overbought territory. Notably, there are no bearish divergences or other bearish signals at this time.
Solana Weekly Chart: Strong Bullish Momentum Continues.
On the weekly chart, Solana shows mostly bullish signs. The MACD histogram has been trending higher since last week, with the MACD lines crossing strongly. However, the RSI is in an overbought range, which could indicate a bearish divergence.
Read More: Solana (SOL) Price Prediction 2024/2025/2030
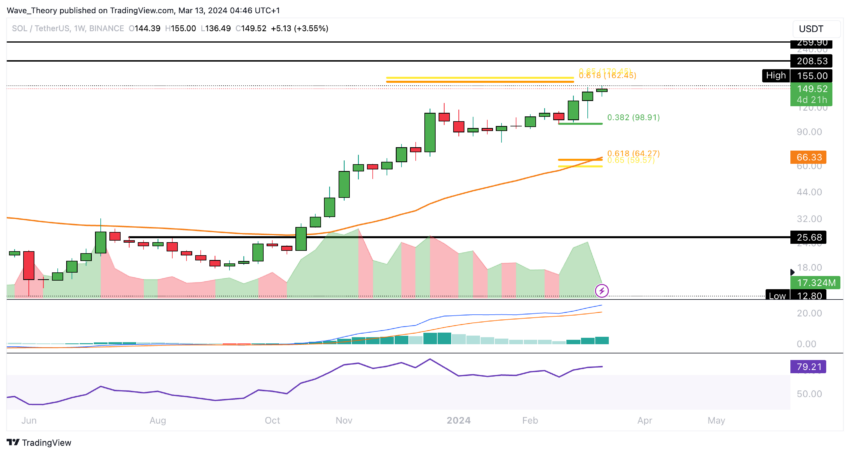
If Solana experiences a bearish breakout at the $170 golden ratio level, it could find support around $99 and $60, with the 50-week exponential moving average (EMA) providing additional support around $66.3.
Daily chart of Solana: MACD showing a bearish signal
On the daily chart, Solana shows some bearish signals alongside the bulls. Although the MACD lines remain strongly crossed, the MACD histogram has been subtly declining.
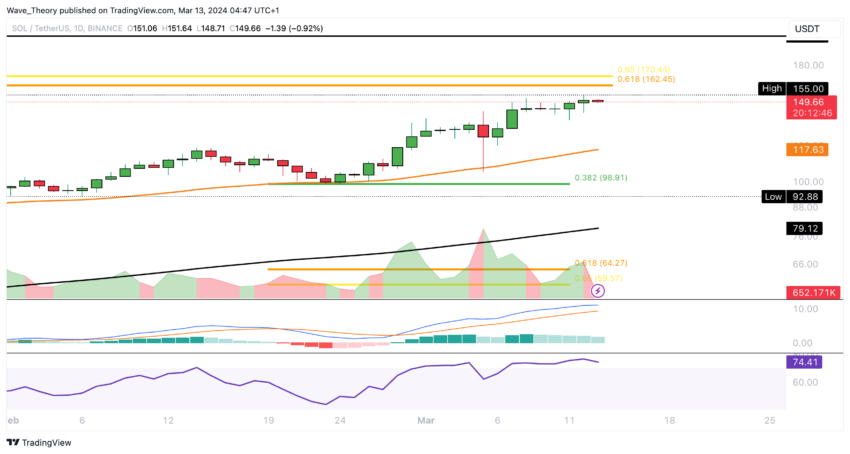
Additionally, the RSI is in overbought territory. However, the AMA Golden Cross indicates a bullish trend in the short to medium term.
Solana 4H Chart: Mixed signals from indicators
In Solana's 4-hour chart, the indicators present a mixed picture. When the MACD histogram trends lower and the MACD lines cross subtly, the RSI remains neutral.
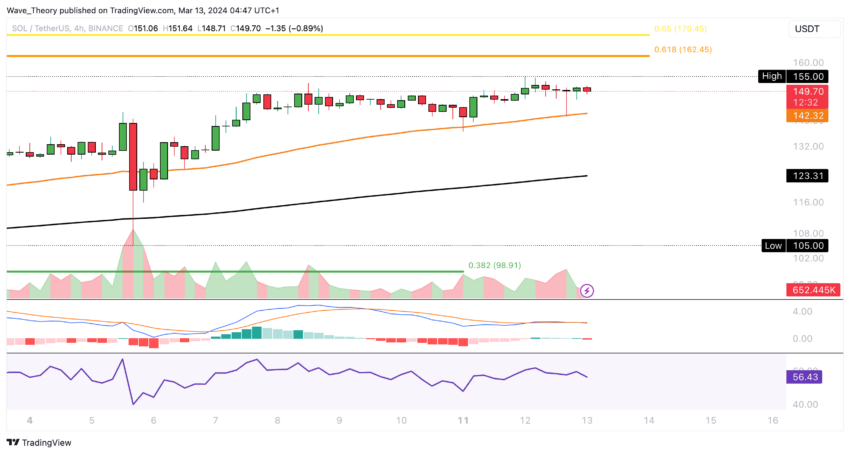
However, the EMA's golden cross indicates a short-term bullish trend.
Solana found strong support in Bitcoin at the 0.382 Fib level.
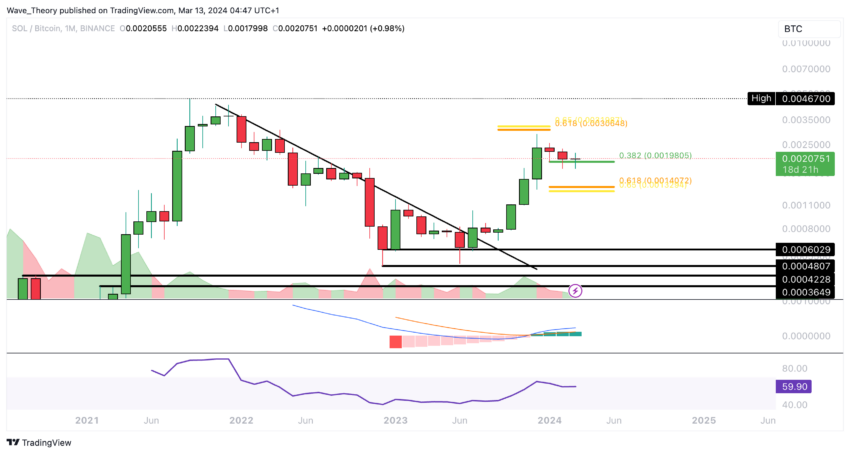
On BTC, Solana's price continues to find significant Fibonacci support around 0.00198 BTC, which has been successful so far. If Solana bullishly breaks out of this level, the golden ratio could target around 0.003 BTC.
Read more: How to buy Solana (SOL) and everything you need to know
Otherwise, the next significant support is located around 0.0014 BTC. On the monthly chart, the indicators remain bullish, with the MACD histogram trending upwards, MACD lines crossed strongly and RSI in neutral territory.
Disclaimer
In accordance with Trust Project guidelines, this price analysis article is for informational purposes only and should not be construed as financial or investment advice. BeInCrypto is committed to accurate, unbiased reporting, but market conditions are subject to change without notice. Always do your own research and consult with a professional before making any financial decisions. Please note that our terms and conditions, privacy policies and disclaimers have been updated.


