Are we going to $48,500?
The price of Bitcoin has been struggling lately as the market sentiment is not good. Let's break down what's going on with BTC and why things are looking a little bleak.
Hard place for Bitcoin
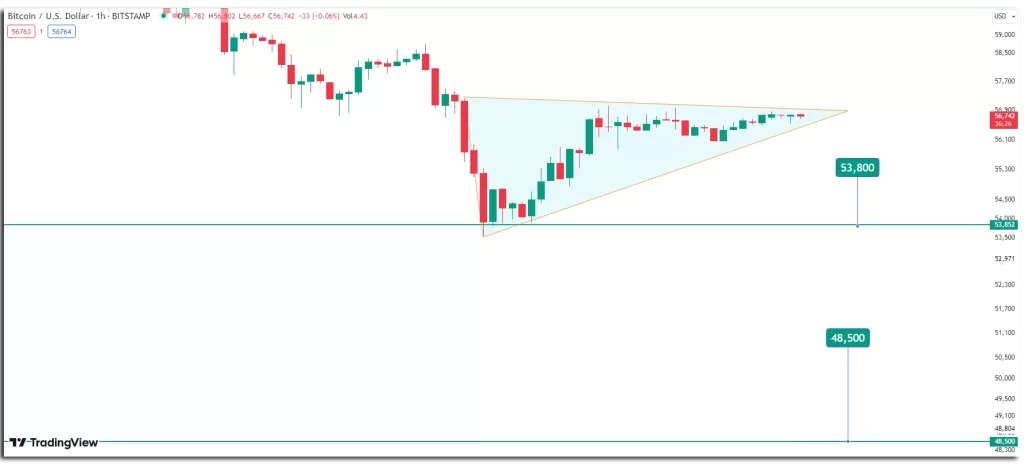
If you're looking at Bitcoin's 1-hour chart, you may have noticed that BTC is stuck at $56,700. It's caught between the 20-day and 50-day moving averages, like it's stuck in traffic.
The price started to decline from $64,000 and found some support at $53,800. But every time it tries to go higher, it gets pushed back by the 50-day moving average at $57,000. Although it has found some support at the $56,000 level, it does not give us much hope.
Increasing wedge warning
Now, the chart shows a rising wedge pattern. This is usually not good news. It looks like BTC is trying to climb a slippery slope, and for the past four hours all the hourly candles have been dojis – small movements that show the market's uncertainty. This means that even a small amount of bad news can send BTC lower, causing the price to drop.
More bad news
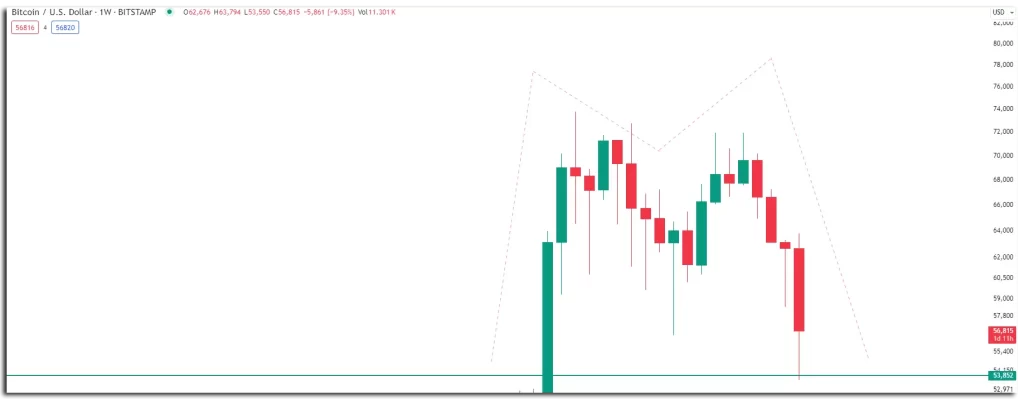
If we look at the weekly chart, we see another bad sign there – the double top or “M” pattern. This usually indicates a large change after the high, which adds fuel to the negative sentiment.
Endless symptoms of depression
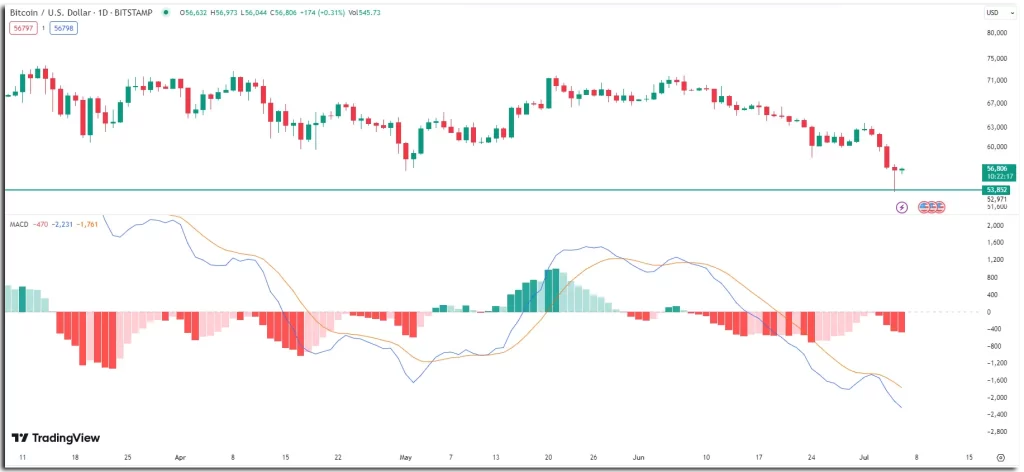
The MACD indicator is also showing negative signals. It's another sign that the bears are in control. The MACD line tried to cross the signal line and failed.
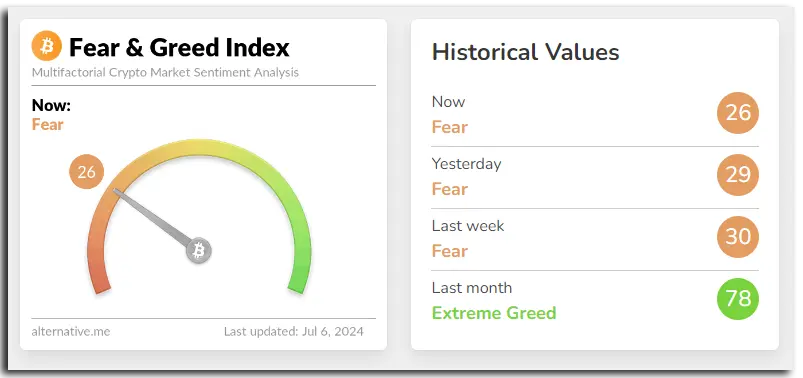
On the other hand, the index of fear and greed also decreased by 3 points to 26, which shows that fear is increasing in the market compared to yesterday.
BTC may be heading to the bears.
If the bears continue to push, the price of Bitcoin could drop as low as $48,500. Current patterns and indicators all point to tough times ahead for BTC.
The price of Bitcoin is currently struggling. A combination of negative patterns appears on the chart. Patterns such as ascending wedges and double tops, along with negative indicators such as the MACD and a declining fear and greed index, suggest that sellers are dominating the market. Traders and investors should be cautious as the market may decline further if the negative sentiment persists. However, it can also be an opportunity for some people.


