As bullish signs fade, ETH price rises 4%

The price of Ethereum (ETH) is up more than 4% in the last 24 hours, although it has fallen by 17% in the last 30 days. In the last few days, ETH has been trying to stay above the $3,000 level, the main psychological and technical area that could influence its next move.
While indicators such as Relative Strength Index (RSI) and Directional Movement Index (DMI) have shown bullish signs of ETH recently, its strength appears to be fading. Whether ETH can regain its growth or face further corrections depends on holding critical support levels and overcoming nearby resistance zones.
ETH RSI has dropped from overbought levels
The ETH Relative Strength Index (RSI) is currently at 54.8 after reaching a low of 22.2 three days ago and a high of 68.9 the day before. This movement represents a rapid change in momentum as ETH moves from oversold to levels close to overbought territory before moving closer to neutral.
The RSI's decline from 68.9 to 54.8 indicates a sharp slowdown, as sellers have gained some ground after the recent rally.
RSI, the Momentum Oscillator, measures the speed and magnitude of price movement on a scale of 0 to 100. Typically, an RSI below 30 indicates oversold conditions and the potential for an upward trend, while an RSI above 70 indicates overbought conditions. , often before the price adjustment.
The ETH RSI is now at 54.8, placed in the neutral zone, indicating the balance between buying and selling. However, a break below 68.9 could indicate that the recent rally is running out of steam, possibly signaling a period of consolidation or a mild correction unless there are new downside risk factors.
Ethereum's growth may be fading.
Ethereum DMI chart ADX is currently at 21.9, down from 39 three days ago, indicating a significant decline in trend strength.
+DI fell to 27.2 from 34.1 a day earlier, indicating bullish momentum, while -DI rose to 26.5 from 18.2, indicating increasing bearish pressure. This combination reflects a market in which buyers are losing their dominance and sellers are becoming more active.

ADX measures trend strength, with values above 25 indicating a strong trend and below 20 indicating a weak or indecisive market. Currently, the ADX is close to 21.9, indicating that the bullish strength in the ETH price will decrease.
With +DI only slightly above -DI, the balance of power is shifting, indicating that unless bullish momentum recovers, ETH may struggle to sustain its growth and enter a consolidation phase or pull back.
ETH Price Prediction: Will it return to the $4,000 levels in January?
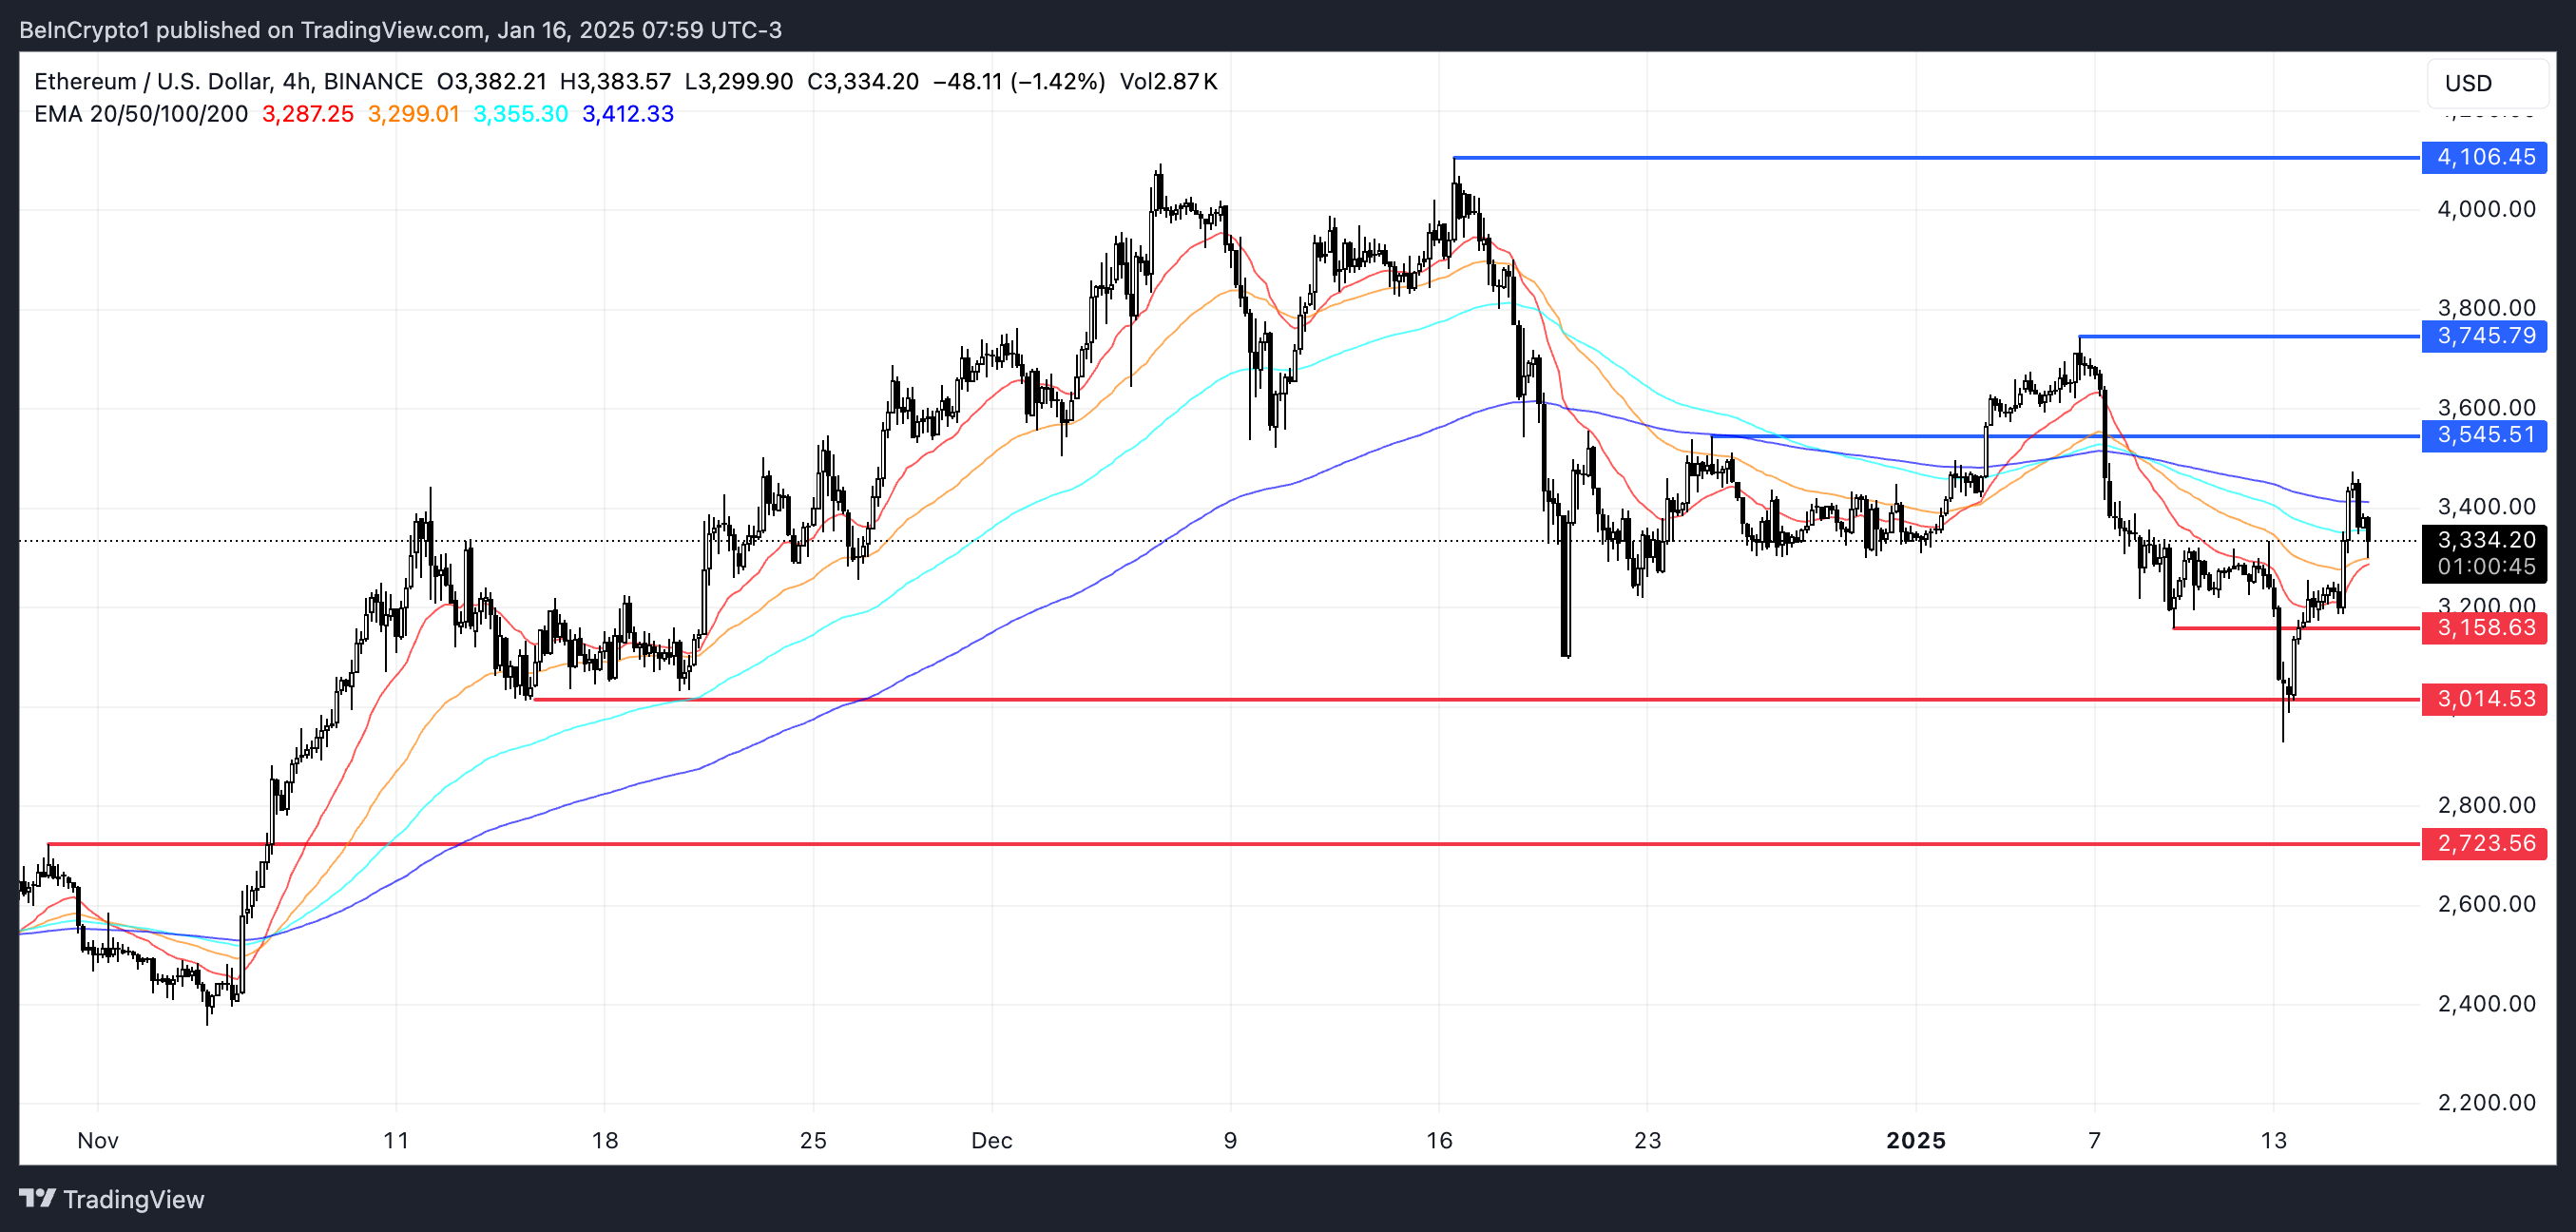
Ethereum price is currently trying to form a strong uptrend, with short-term moving averages trying to cross above the long-term, a classic bullish sign.
However, indicators such as ADX and RSI suggest that the momentum of the bull may be weakening.

If the trend changes, ETH may test the first support level at $3,158. A break below could see the price of ETH drop to $3,014. If this level fails to hold, ETH could fall as low as $2,723, representing an 18.4% correction. On the contrary, if the strength of the rise returns, ETH may test the resistance at $3,545.
Breaking this level could pave the way for a move towards $3,745 and if the momentum remains strong, the price of Ethereum could reach $4,106. This marks a major milestone, pushing ETH above $4,000 for the first time since mid-December 2024.
Disclaimer
In accordance with Trust Project guidelines, this price analysis article is for informational purposes only and should not be construed as financial or investment advice. BeInCrypto is committed to accurate, unbiased reporting, but market conditions are subject to change without notice. Always do your own research and consult with a professional before making any financial decisions. Please note that our terms and conditions, privacy policy and disclaimer have been updated.


