Bitcoin, Ethereum, XRP Price Prediction: Make or Break the Bargain?

The crypto market has recorded a strong bullish action in the past few days, with massive inflows of digital assets. Moreover, with the global market value exceeding $2.10 trillion, the price of Bitcoin has returned to the level of $60,000.
Following this, top tokens such as Ethereum and Ripple have breached important resistance levels and are on the verge of a potential breakout rally.
Are you wondering how the 3 oldest cryptocurrencies are doing at a time of increasing uncertainty in the crypto market? Fear not and hope this article can be for you!
Bitcoin Price Tested The $60K Resistance Level!
After a ~1% jump in the previous day, BTC price continues to hover around the $60k resistance/support level. However, the star crypto has gained 9.91% in the last week and 2.68% in the last month. This shows the increasing bullishness for Bitcoin prices.
The Relative Strength Index (RSI) recorded a stable price trend in the 1D time frame. However, the average trend line shows a bullish curve. This suggests mixed price sentiment for the Bitcoin token.
If the market puts the price of BTC above the important level of $60k, the bulls will be encouraged again and will be set for the next resistance level of $66k. However, a bearish reversal could lower the price to $58,000.
Read our Bitcoin (BTC) price prediction to see if $100k is still possible by 2024!
Ethereum price has declined on bullish action.
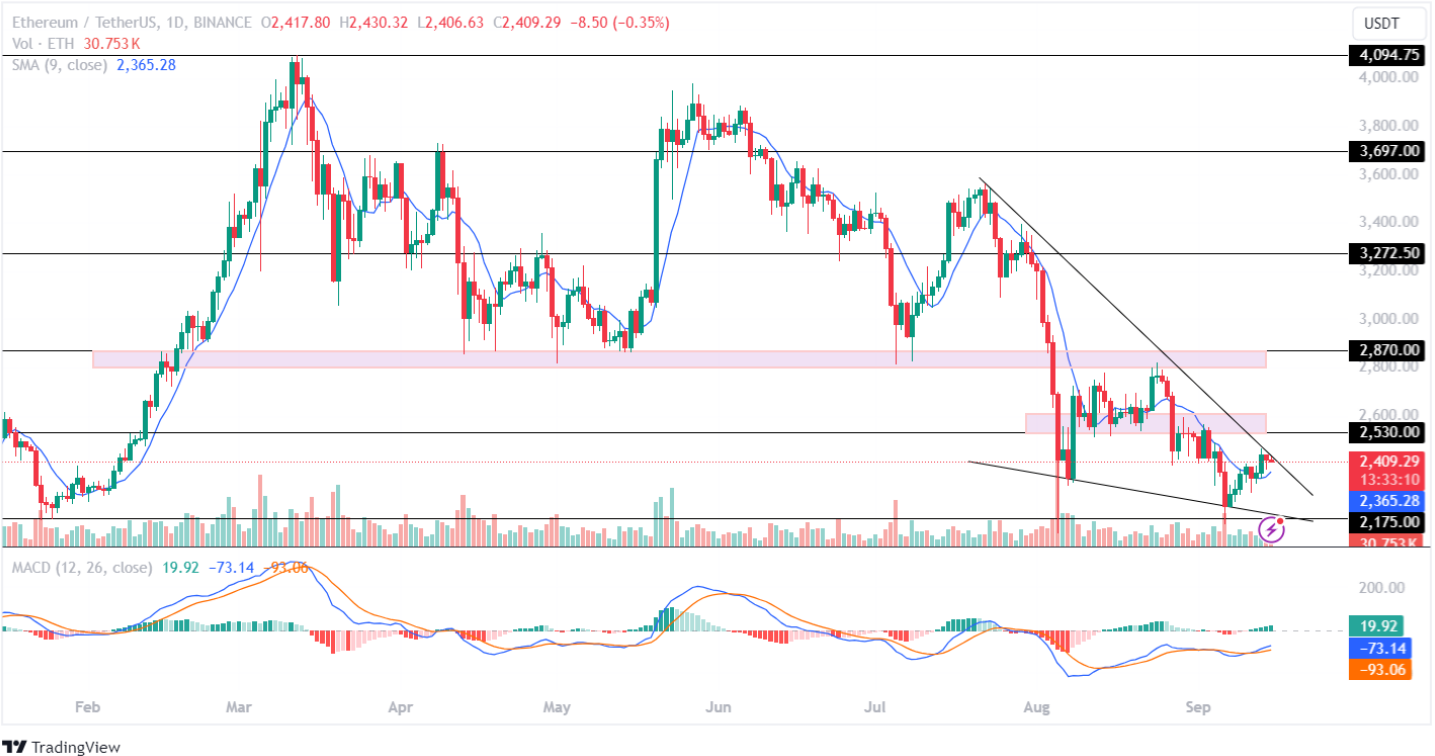
Following in the footsteps of the market leader, the price of Ethereum remains above the $2.4k mark, despite registering a 0.59% decline in the previous day. However, the largest altcoin is on the verge of testing the resistance trend in the 1D time frame.

Moving Average Convergence Divergence (MACD) in the green histogram showed a steady rise in the moving average. This shows a positive outlook for the price of Ethereum in the coming week.
A breakout from the resistance trend of the triangle pattern could result in the ETH coin price being set to test the $2.5k resistance level. Conversely, a rejection could cause it to retest the critical support level of $2,175 this month.
XRP Price Fails To Break Out Of Symmetric Triangle Pattern!
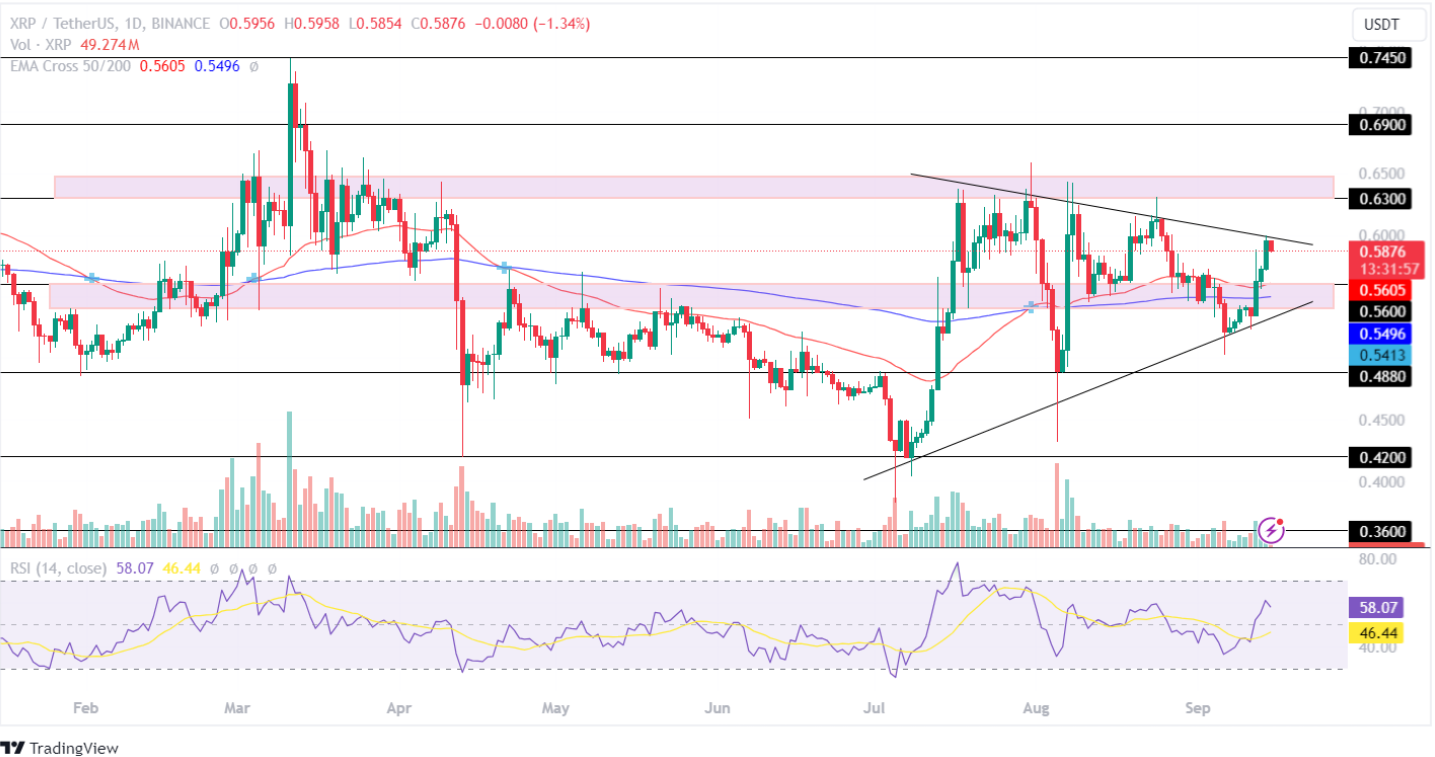
With a jump of ~11% last week, Ripple's price breached the important protection zone of $0.56. However, it failed to break out of the triangle pattern resistance trend. This shows mixed price sentiment in the market for XRP crypto.

The 50/200-day EMA recorded a persistent flat line in the 1D time frame. This highlights the weak buying and selling pressure for altcoins in the crypto market. Additionally, the RSI indicator has experienced a bearish curve, indicating increased volatility for the XRP crypto token.
If the bulls recover their momentum, the price of Ripple will break the resistance trend and reach the high level of $0.630 this month. Conversely, if the bears beat the bulls, the altcoin could drop to a low of $0.560.
Concerned about your XRP holdings? Read our XRP price forecast for future insights.


