Can Celestia (TIA) Price Retrace Above Key Resistance Levels?

Celestia (TIA) price is uncertain as both trend indicators and key levels fail to provide a clear direction. The ADX and Ichimoku Cloud show weak momentum, indicating the absence of critical strength from bulls or bears.
When EMA lines and support/resistance levels give hints of consolidation, a break in either direction is required to determine the next significant move.
TIA's next direction is still undecided.
The ADX (Average Direction Indicator) on the TIA DMI chart (yellow line) stands at 16.5, indicating a weak trend. ADX is a momentum indicator used to assess the strength of a trend, regardless of its direction.
Typically, an ADX value below 20 indicates that the trend is not strong, while values above 25 indicate a more defined trend. At the current price of 16.5, TIA has no clear momentum, indicating that any trend – bullish or bearish – lacks significant strength.
+DI (blue line) is at 15.6, while -DI (red line) is at 17.3. +DI represents bullish pressure, and -DI represents bearish pressure. Since -DI is higher than +DI, it indicates that bearish pressure is slightly dominant at the moment.
Given the weak ADX reading, this suggests that while the bears are in control, their control over TIA's price action is not strong. As a result, the TIA price will remain range bound or show little movement until a stronger move develops.
Read more: 10 Best Altcoin Exchanges in 2024
Ichimoku Cloud also shows mixed signs for Celestia
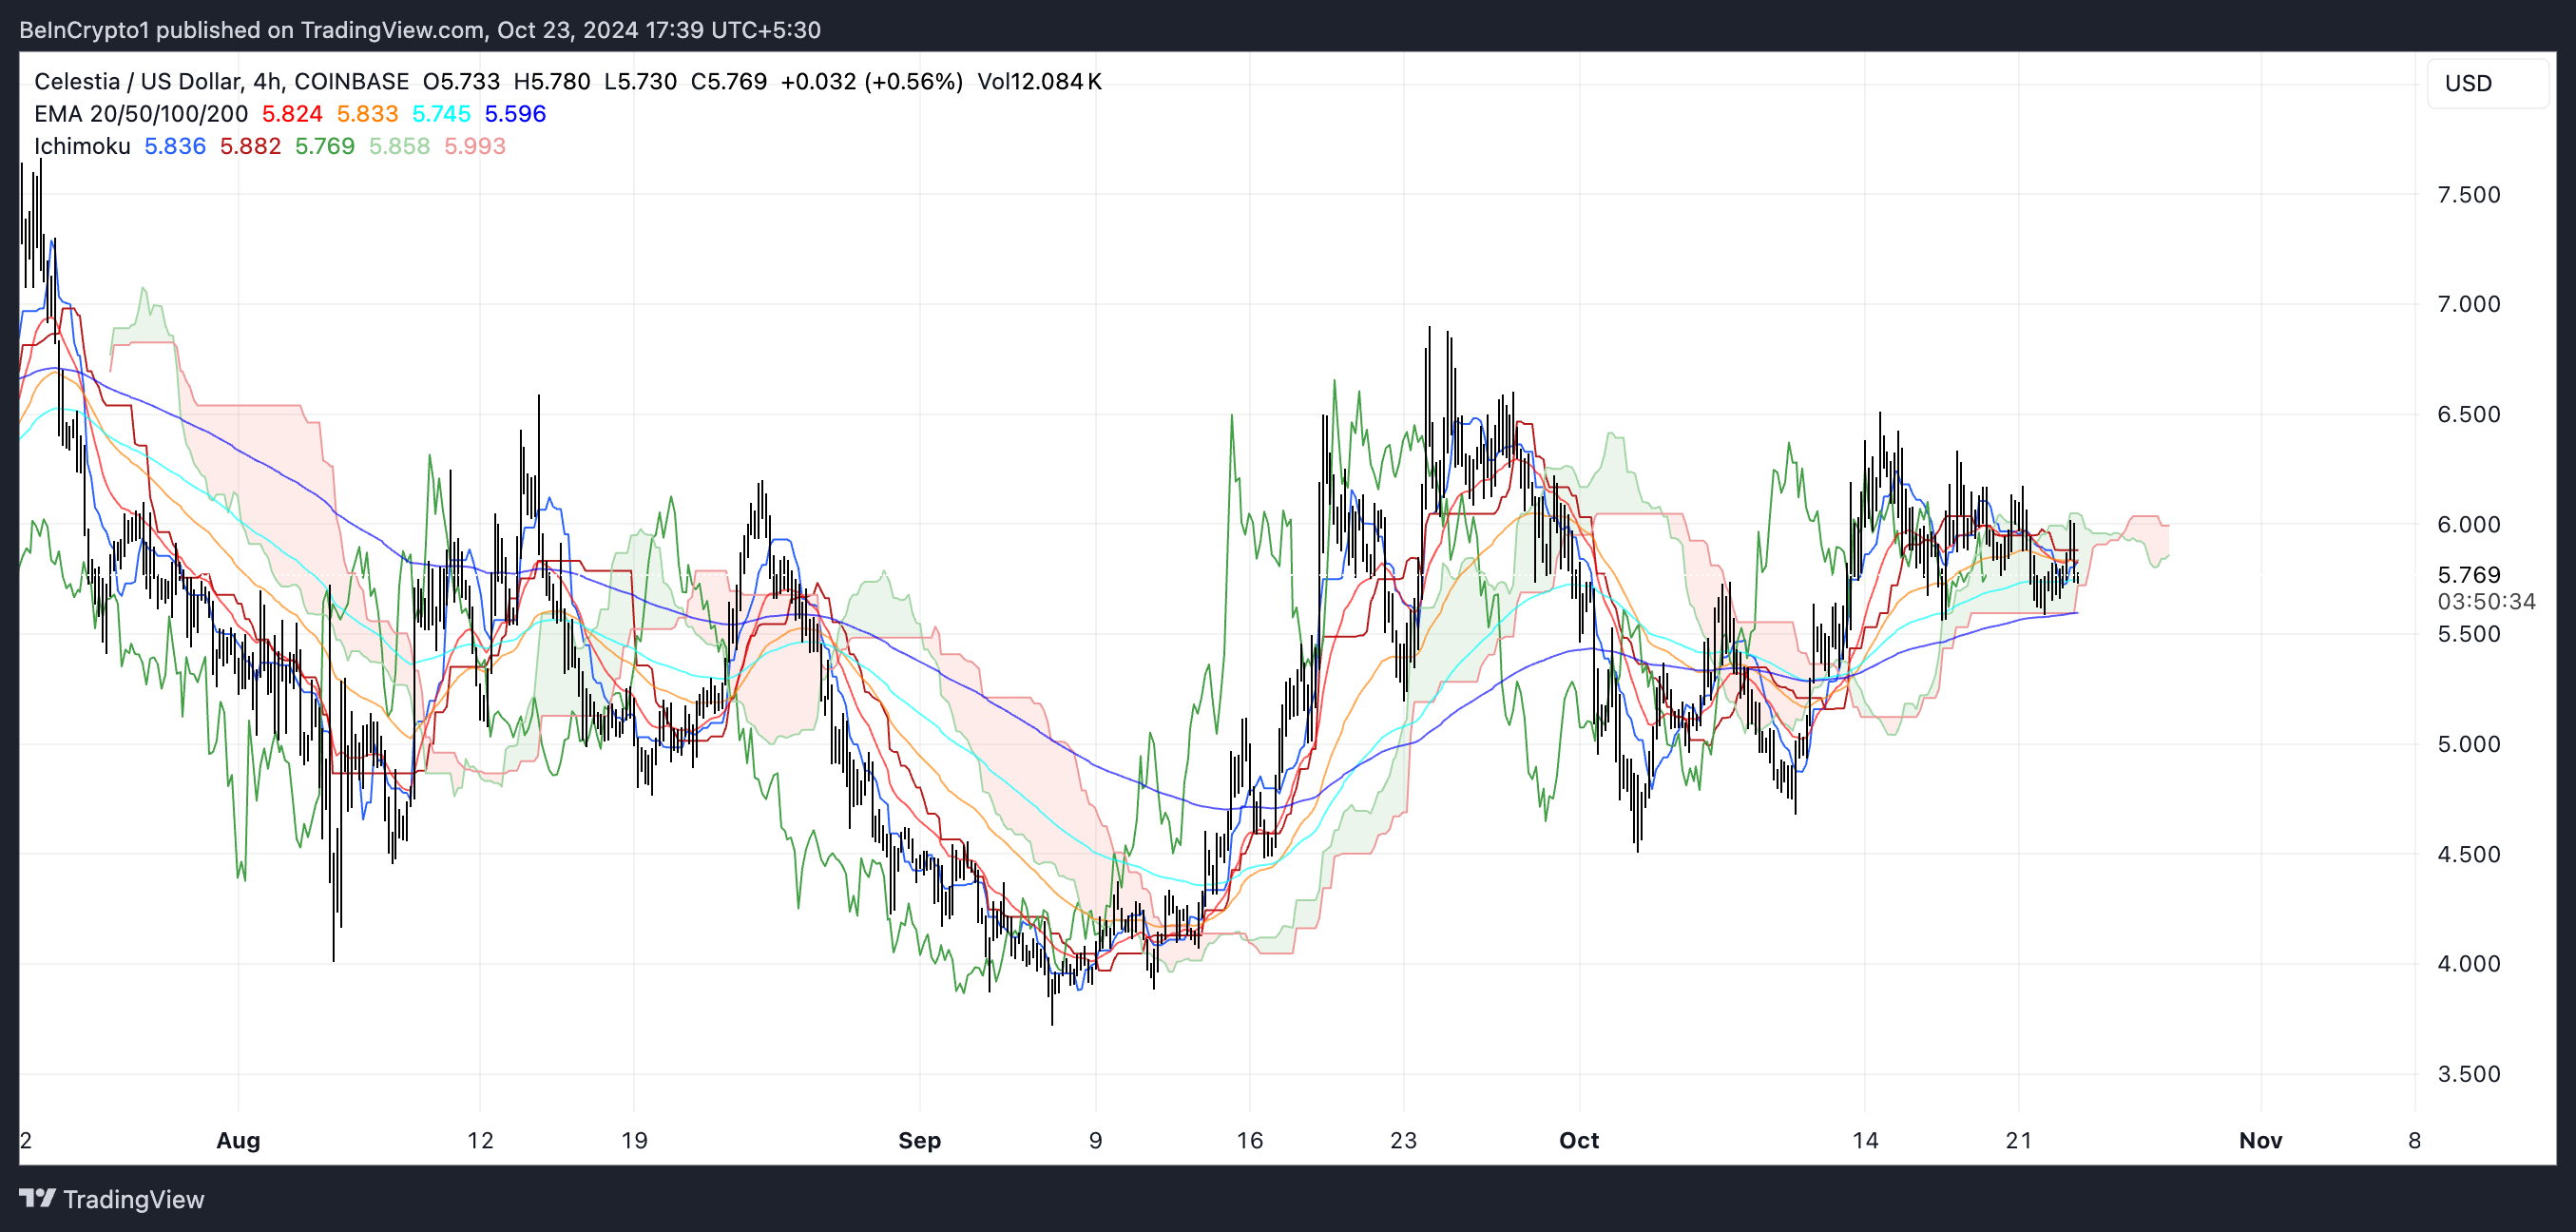
The Ichimoku Cloud chart shows a mixed picture of TIA. Currently, the price is sitting near the cloud, which is an uncertain place. When prices are in or near the cloud, it indicates a period of consolidation or determination in the market.
If the price manages to break above the cloud, it may indicate a bullish trend, while a break below may indicate a bearish move. The thickness of the cloud ahead also plays a role; A thick cloud indicates strong resistance or support.

Tenkan-sen (conversion line) and Kijun-sen (base line) are relatively close, suggesting that momentum is not supported on either side. The future cloud is also mixed, which indicates the absence of a strong directional trend.
In this sense, the next TIA price movement may depend on its ability to clear the resistance of the cloud or break the support sideways. In the meantime, traders should watch for a clear breakout from either direction to assess the next significant move.
TIA Price Forecast: Back to $6 in October?
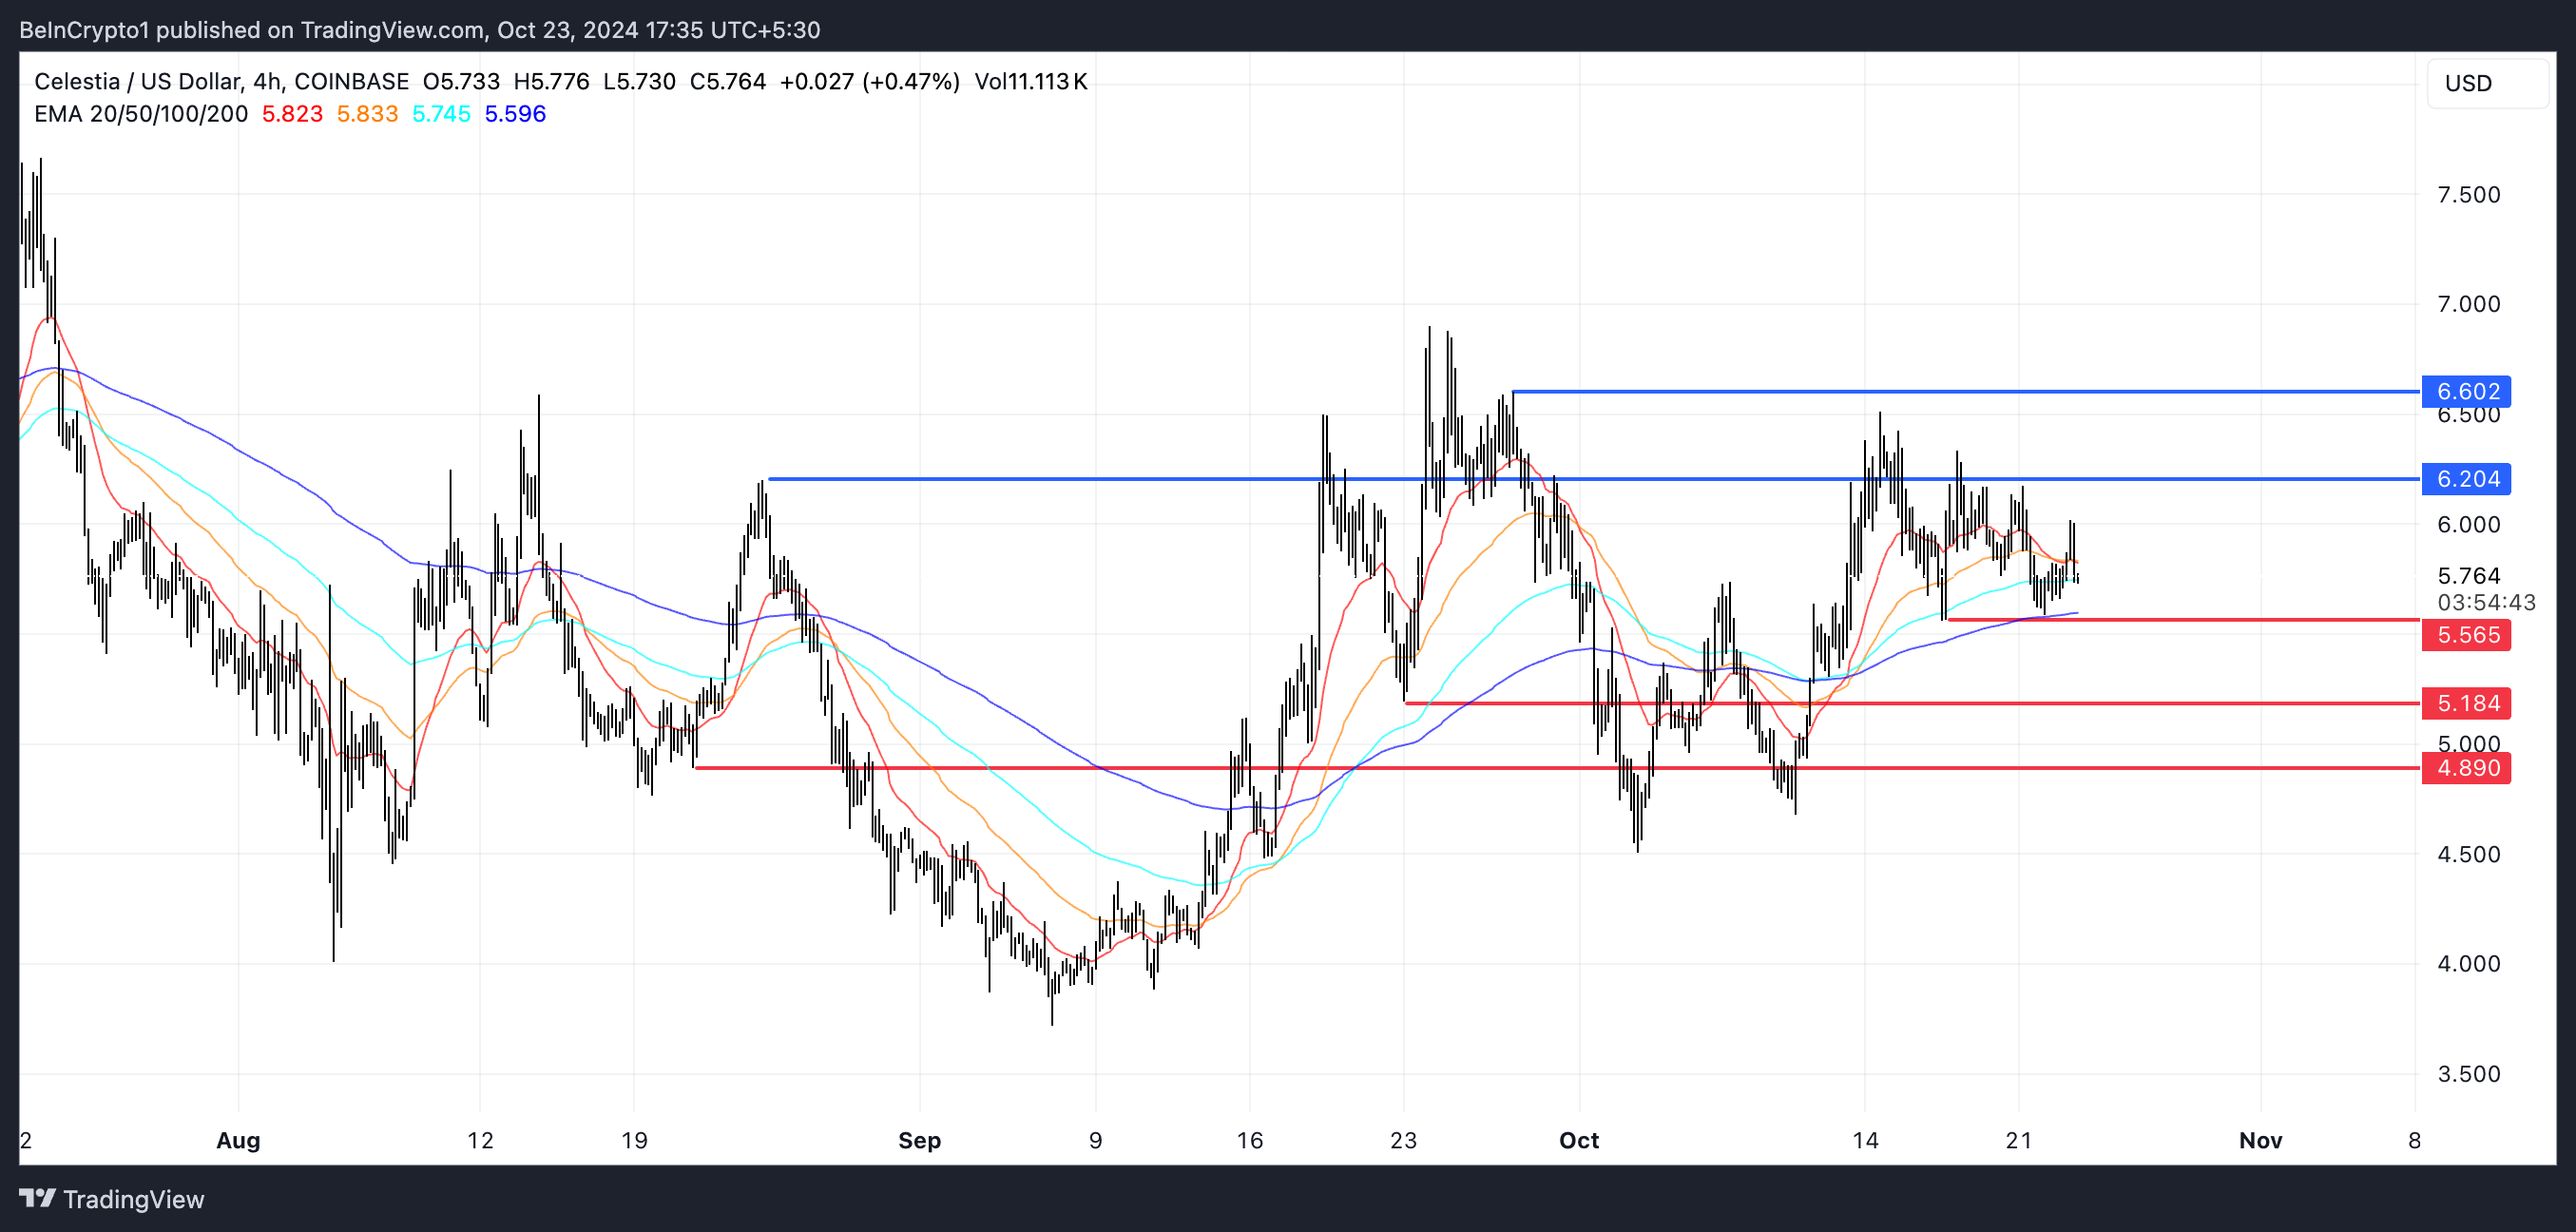
The EMA (Exponential Moving Average) lines on the TIA chart indicate a mix for the price. The EMAs are closely related, with the shorter EMAs hovering slightly above the longer EMAs.
This position suggests that TIA is experiencing a limited rate of acceleration, with neither strong excitation nor depression predominating. Price staying close to all EMAs indicates consolidation, and a trend needs a clear move above or below these EMAs to emerge.
Read more: 3 Altcoins to appear in the fourth week of October 2024

Regarding support and resistance zones, TIA has strong resistance levels marked at $6.20 and $6.60. If TIA price breaks above $6.20, it may try to challenge $6.60.
Conversely, a break below $5.56 could expose the price to deeper retracements to $5.18 or $4.89, indicating a 15% price correction. The current price position indicates a period of indecisiveness, when breaking a key support or resistance will determine the next direction of movement.
Disclaimer
In accordance with Trust Project guidelines, this price analysis article is for informational purposes only and should not be construed as financial or investment advice. BeInCrypto is committed to accurate, unbiased reporting, but market conditions are subject to change without notice. Always do your own research and consult with a professional before making any financial decisions. Please note that our terms and conditions, privacy policies and disclaimers have been updated.


