Mantra (OM) price breaks records with strong upward momentum.

Mantra (OM) price has been on a strong uptrend, recently hitting new highs and gaining nearly 20% over the past week. This increase is supported by strengthening technical indicators, showing strong motivation and clear growth.
A combination of bullish EMA alignment and favorable indicators such as ADX and Ichimoku Cloud suggest that the rally may extend further, with new highs likely in the coming days. However, if the uptrend loses momentum, OM may test key support zones that determine the sustainability of recent gains.
OM's growth is going strong.
The ADX for OM rose from 16 to 26.48 in just one day, showing a significant increase in trend strength.
An ADX above 25 typically indicates a strong trend, and this rise indicates that OM is moving from a weak or sideways market to a clear and sustained move.
The ADX, or Average Directional Indicator, measures the strength of a trend on a scale of 0 to 100. Values below 20 indicate weak trends, values above 25 signal strength.
With OM's ADX at 26.48, the market is proving bullish, supported by rising momentum and strong directional pressure, suggesting further gains may be on the horizon.
Ichimoku Cloud indicates that the OM trend is bullish
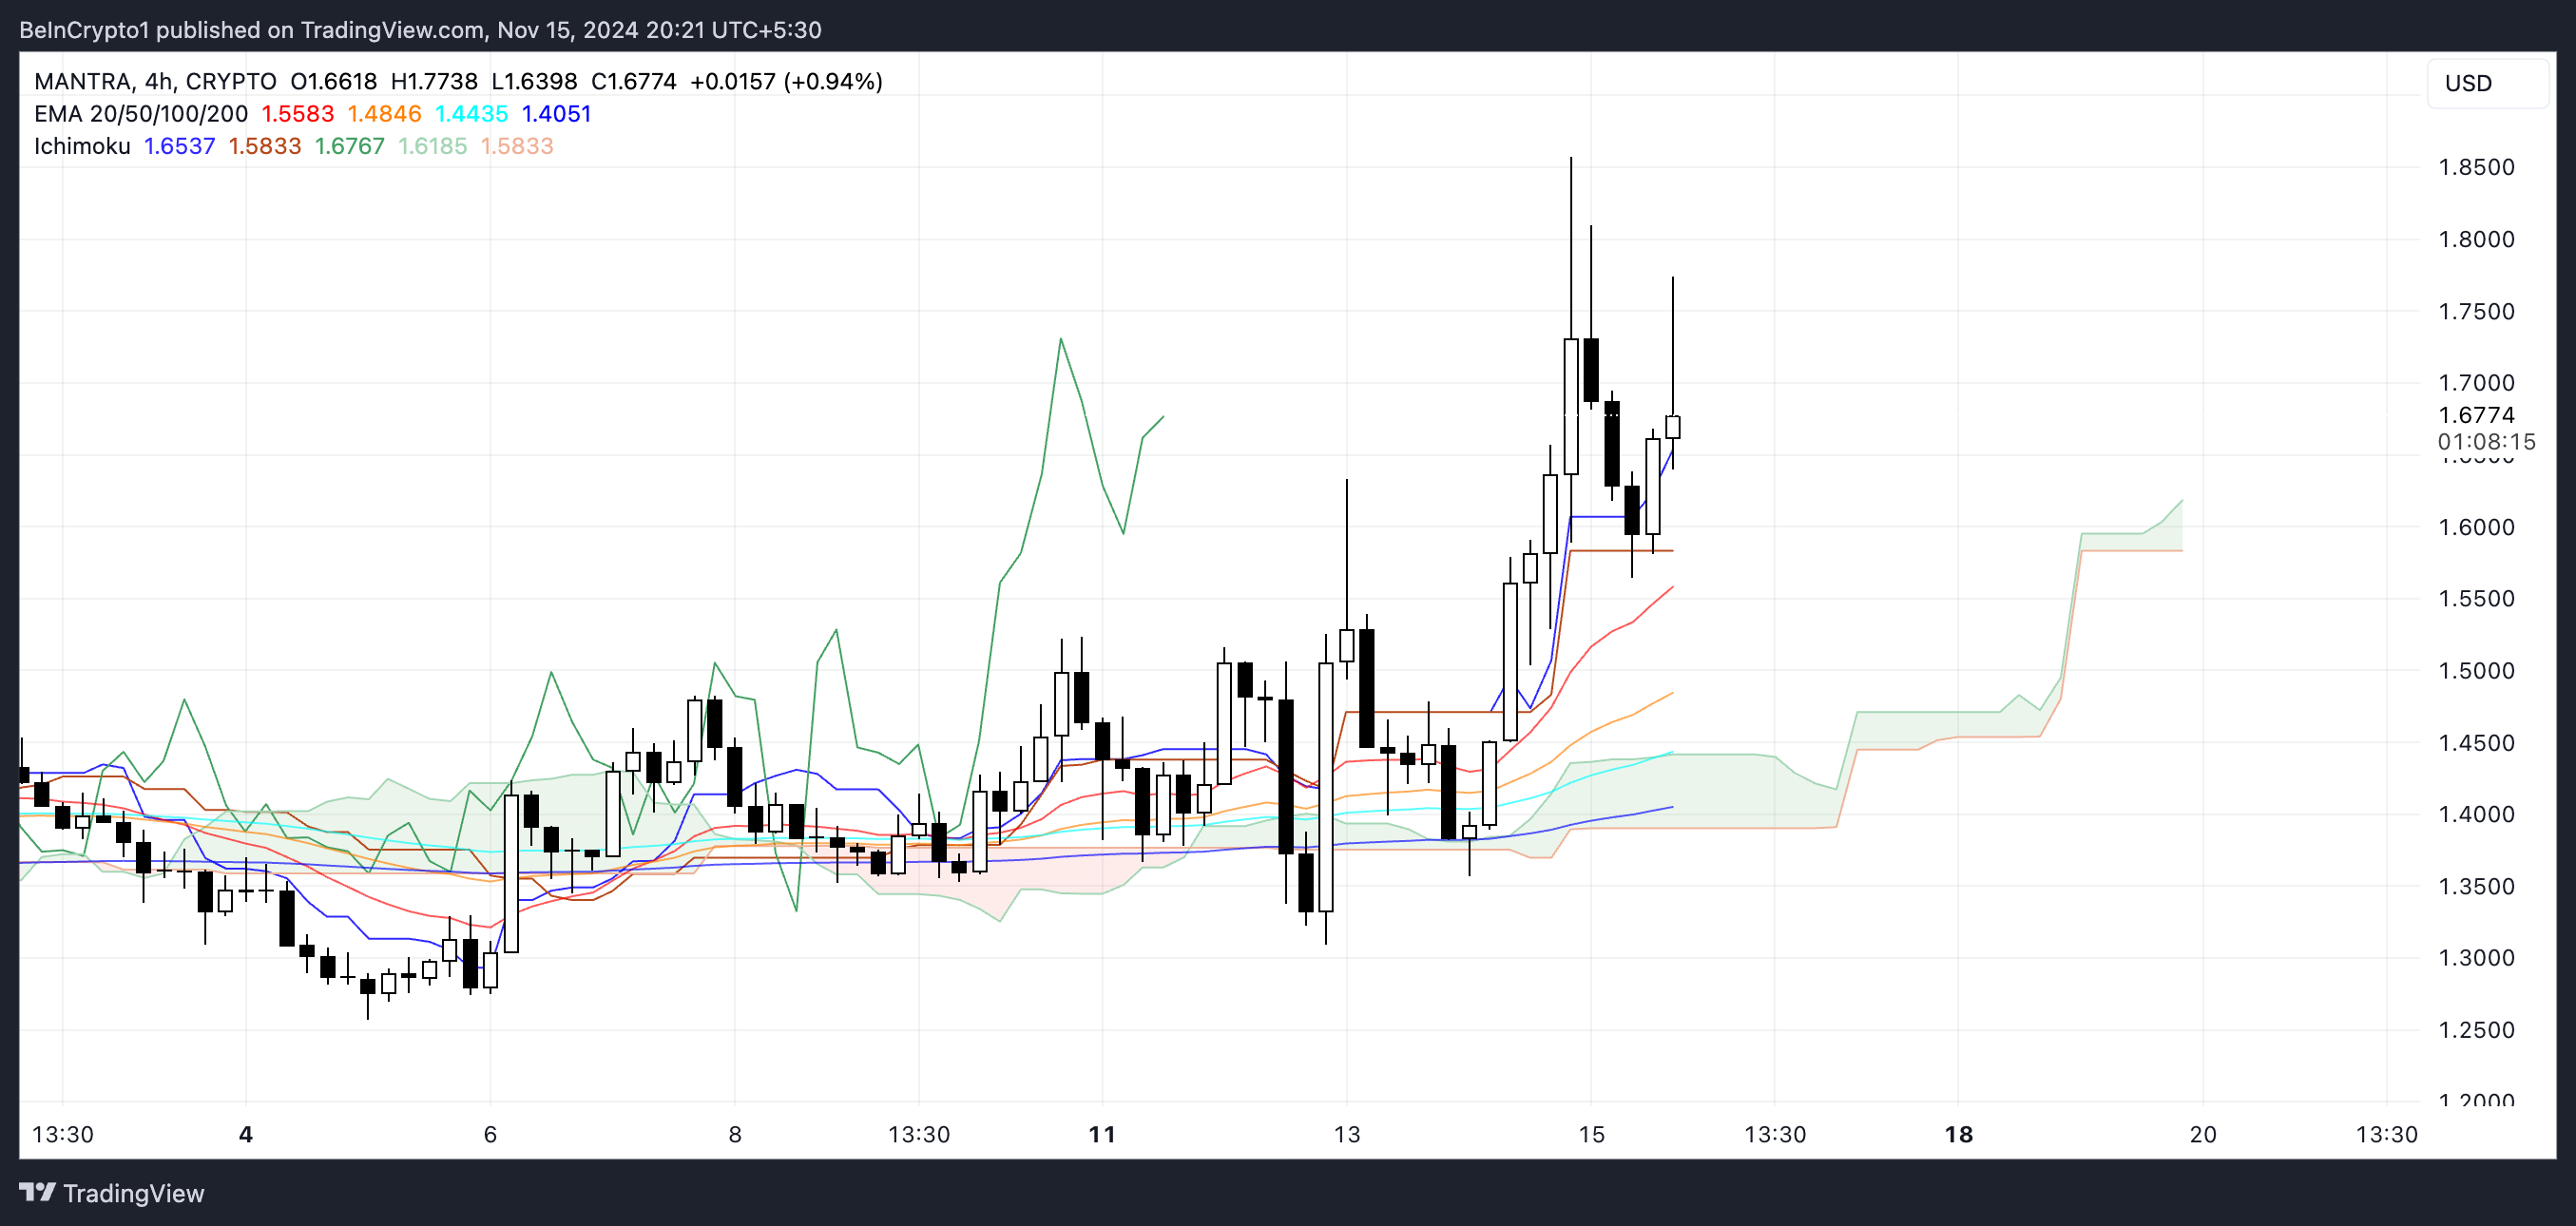
The Ichimoku cloud chart of OM price shows a bullish trend. The price broke above the cloud (kumo), which typically indicates an uptrend.
Additionally, the cloud ahead (Senko span A and B) is green, indicating positive momentum and potential support levels. Price staying above the cloud supports the possibility of continued upward movement.

The Tenkan-Sen (conversion line) is above the Kijun-Sen (baseline), another bullish sign that indicates that the short-term trend is stronger than the long-term trend.
A delay period (Chikou Span) is placed above the price, confirming that the recent price action strongly supports the current trend. Together, these elements highlight a strong sense of empowerment for OM.
OM Price Forecast: New High Soon?
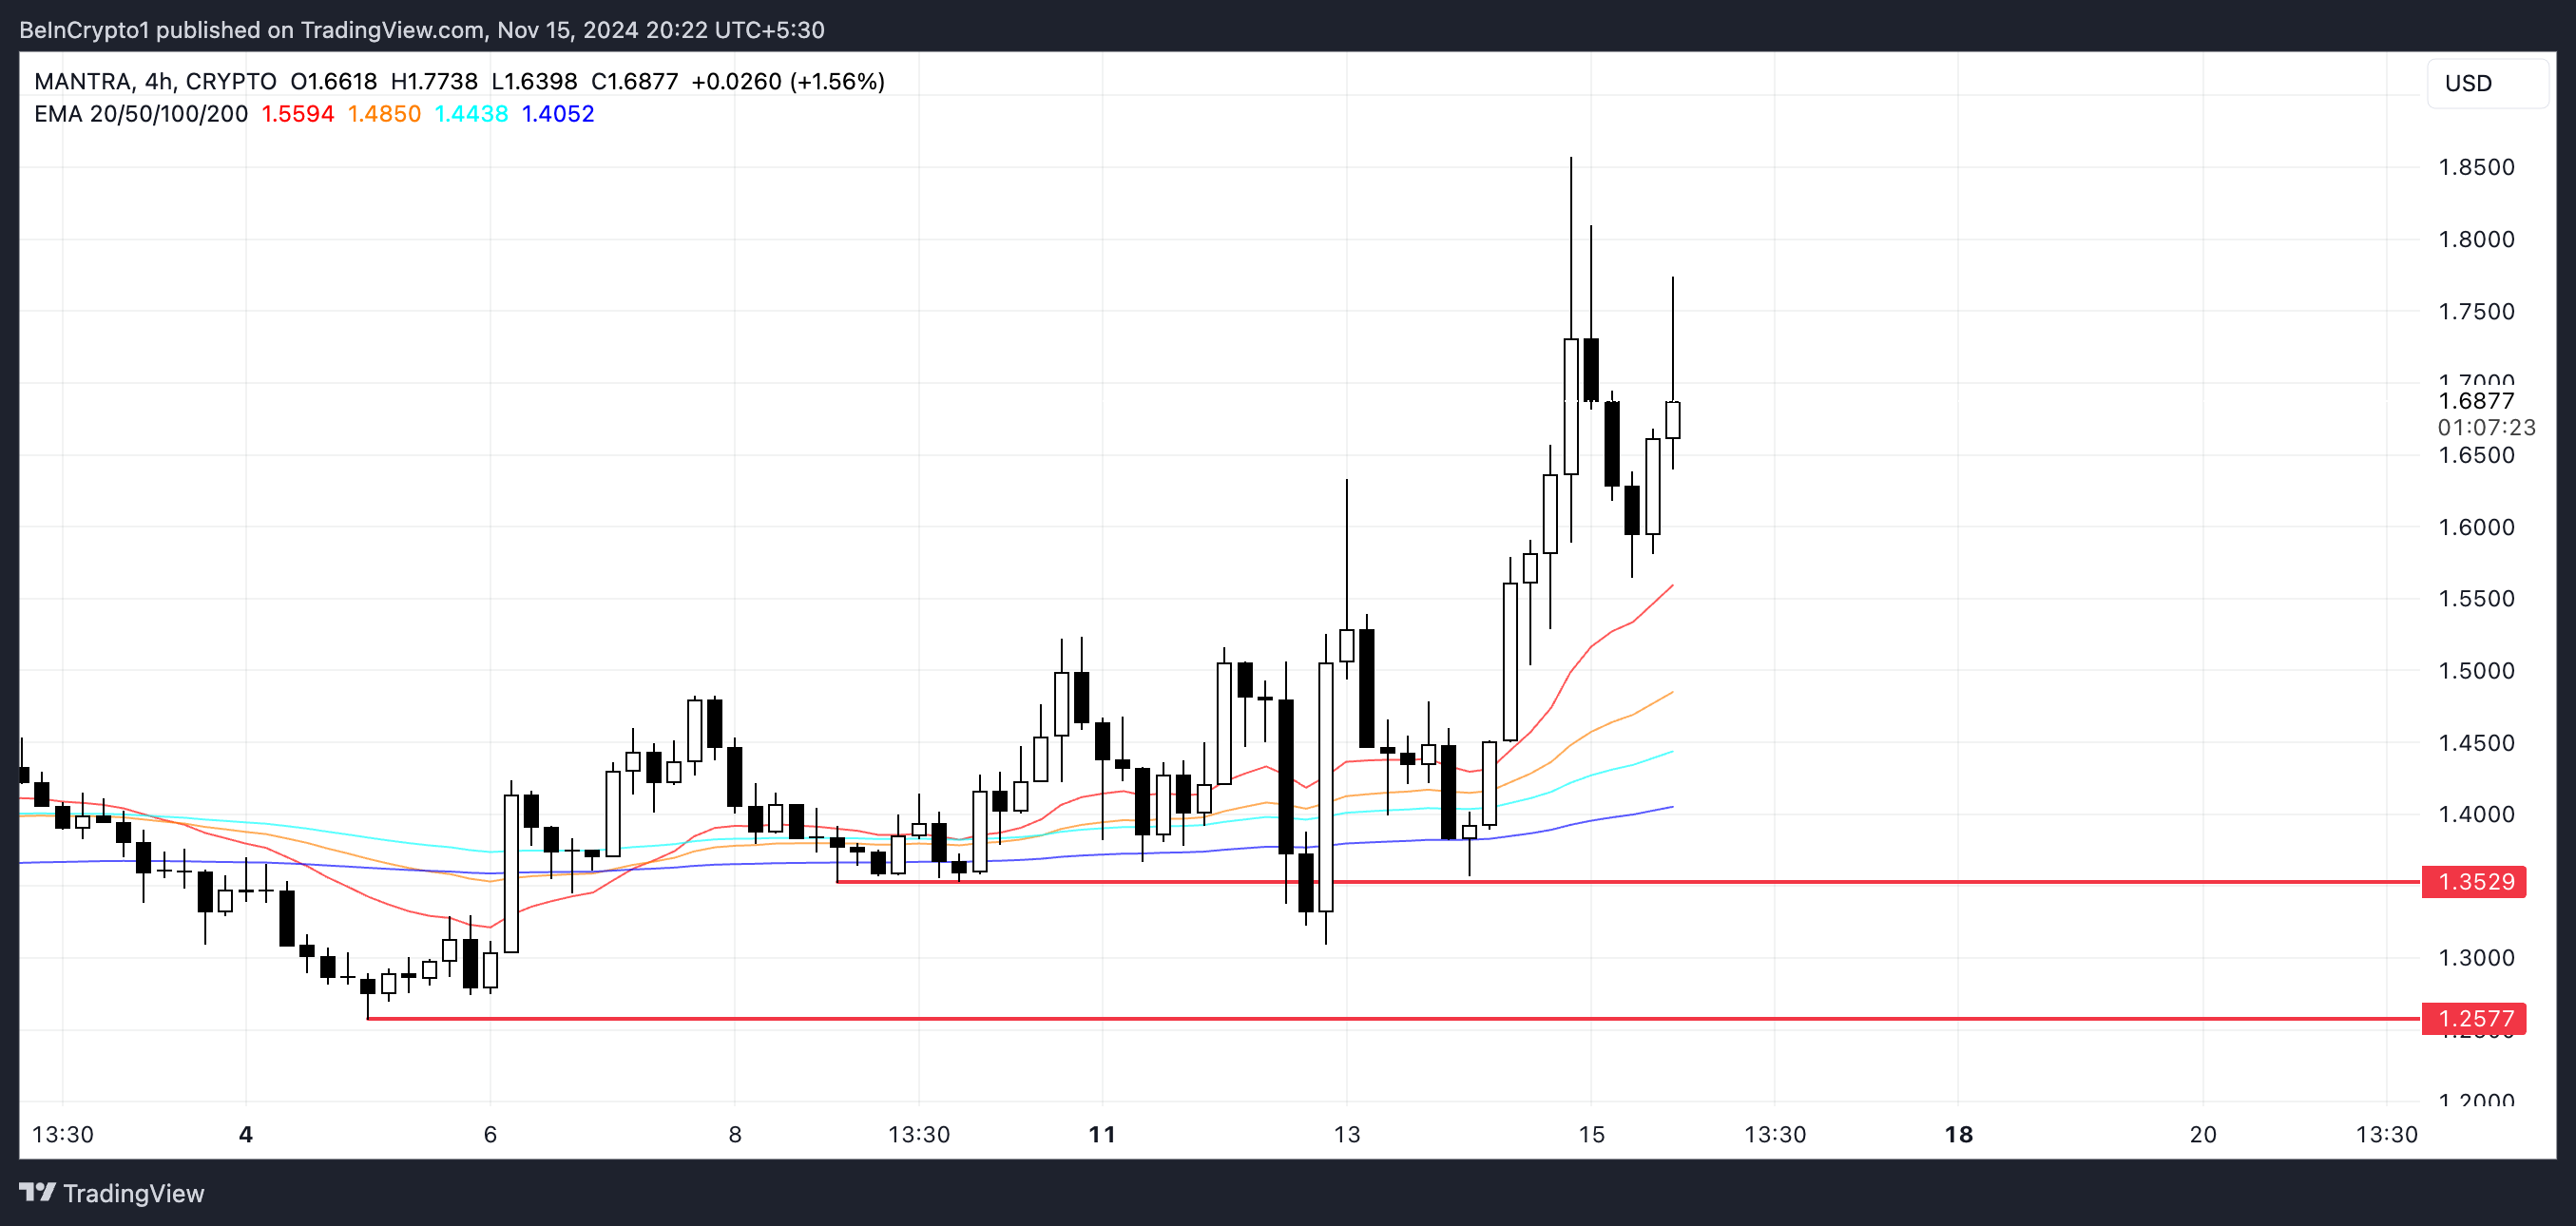
Mantra EMA lines currently show a strong bullish alignment, with price trading above all and short-term EMAs above long-term. It is OM. One of the leading coins in real world assets ecoSystem today and this narrative could benefit a lot if it continues to grow.
This structure reflects strong upward momentum, reinforcing the idea of continued improvement. Recent price action supports this bullish view as OM price has managed to maintain levels above key EMA thresholds.

Combining insights from ADX and Ichimoku Cloud metrics, OM's recent breakout may signal the start of an extended rally to a new all-time high of $1.85. If bullish momentum continues, further tests of new highs are plausible in the coming days as the narrative around real world assets (RWA) recovers momentum.
However, if the uptrend stalls and reverses, OM price may test the first strong support zone at $1.35. If this level fails to hold, the price could fall further, possibly reaching as low as $1.25, a critical support area.
Disclaimer
In accordance with Trust Project guidelines, this price analysis article is for informational purposes only and should not be construed as financial or investment advice. BeInCrypto is committed to accurate, unbiased reporting, but market conditions are subject to change without notice. Always do your own research and consult with a professional before making any financial decisions. Please note that our terms and conditions, privacy policy and disclaimer have been updated.


