Momentum bearing signs of inevitable death cross for HBAR price

Hedera (HBAR) price hit multiple highs in December but has now fallen over 4% in the last 24 hours.
Although many indicators suggest that the correction may end soon, the looming death cross threatens to extend the decline even further.
HBAR is still at a low level.
The Hedera DMI chart shows that the ADX is currently at 18.2, indicating weak trend strength. The +DI (directional indicator) stands at 18.8, while the -DI is slightly higher at 19.3, indicating that bearish momentum remains somewhat dominant.
This setup shows that HBAR is still in a downtrend, but the absence of a strong ADX indicates that the trend is not firmly established, leaving room for changes in market direction.
The Average Directional Index (ADX) measures the strength of a trend on a scale of 0 to 100, regardless of direction. Values above 25 indicate a strong trend, while readings below 20 indicate a weak or trend strength, such as HBAR current 18.2. The proximity of +DI and -DI indicates that neither buyer nor seller is exercising significant control.
In the short term, the HBAR price may remain range-bound or show limited movement until one side gains clear advantage, with a rising ADX to confirm strong trend momentum.
The Ichimoku Cloud hints at further declines
The Ichimoku Cloud chart shows a bearish setup for Hedera, with the price below the red cloud. The red color of the cloud formed by Senkou Span A and Senkou Span B shows that when Senkou Span A is below Senkou Span B, this configuration will keep HBAR under bearish influence, suggesting that bearish pressure will remain in the market.
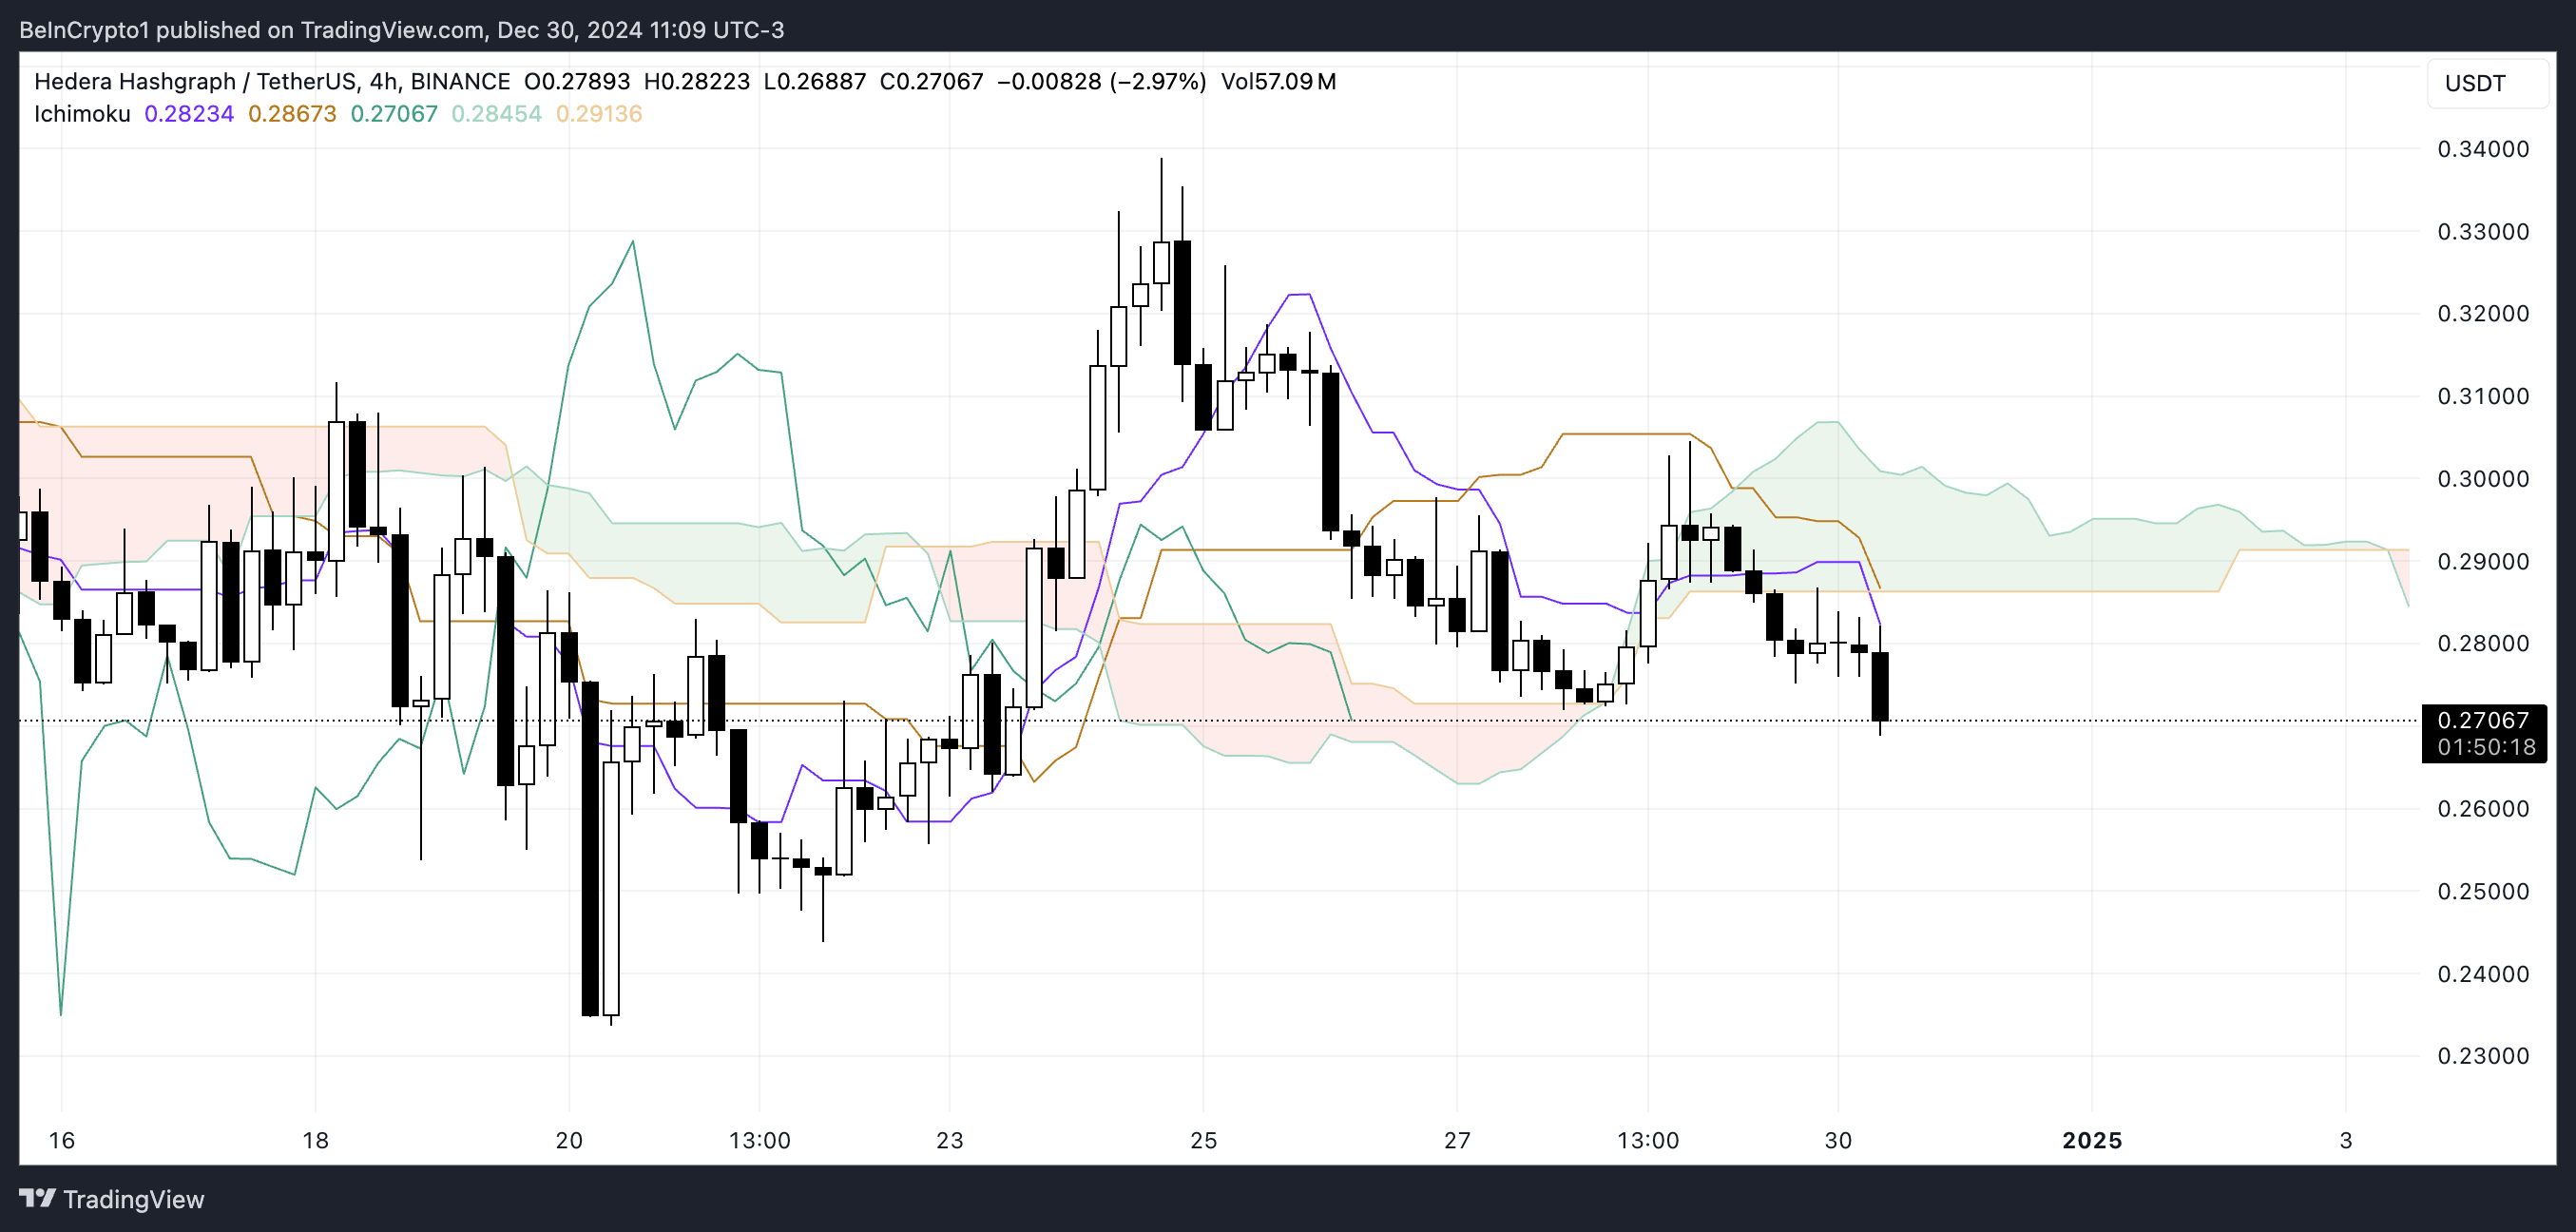
In addition, the purple Tenkan-Sen (conversion line) is below the orange Kijun-Sen (base line), reinforcing bearish sentiment behind the long-term trend in short-term momentum.
The green delay period (Chikou Span) is below the price action and the cloud, further confirming the dominance of bearish conditions. Overall, the Ichimoku setup suggests that HBAR will remain in a downtrend unless it can break above the cloud, indicating a potential reversal.
HBAR Price Forecast: Will Heda Fall 13.7%?
If the current HBAR price decline continues and consolidates, the price may fall further to test the support level at $0.233. This can happen if the short-term line (red line) crosses below the long-term (light blue line). Failure to hold this support could signal an increase in bearish momentum, which could drive the price lower.
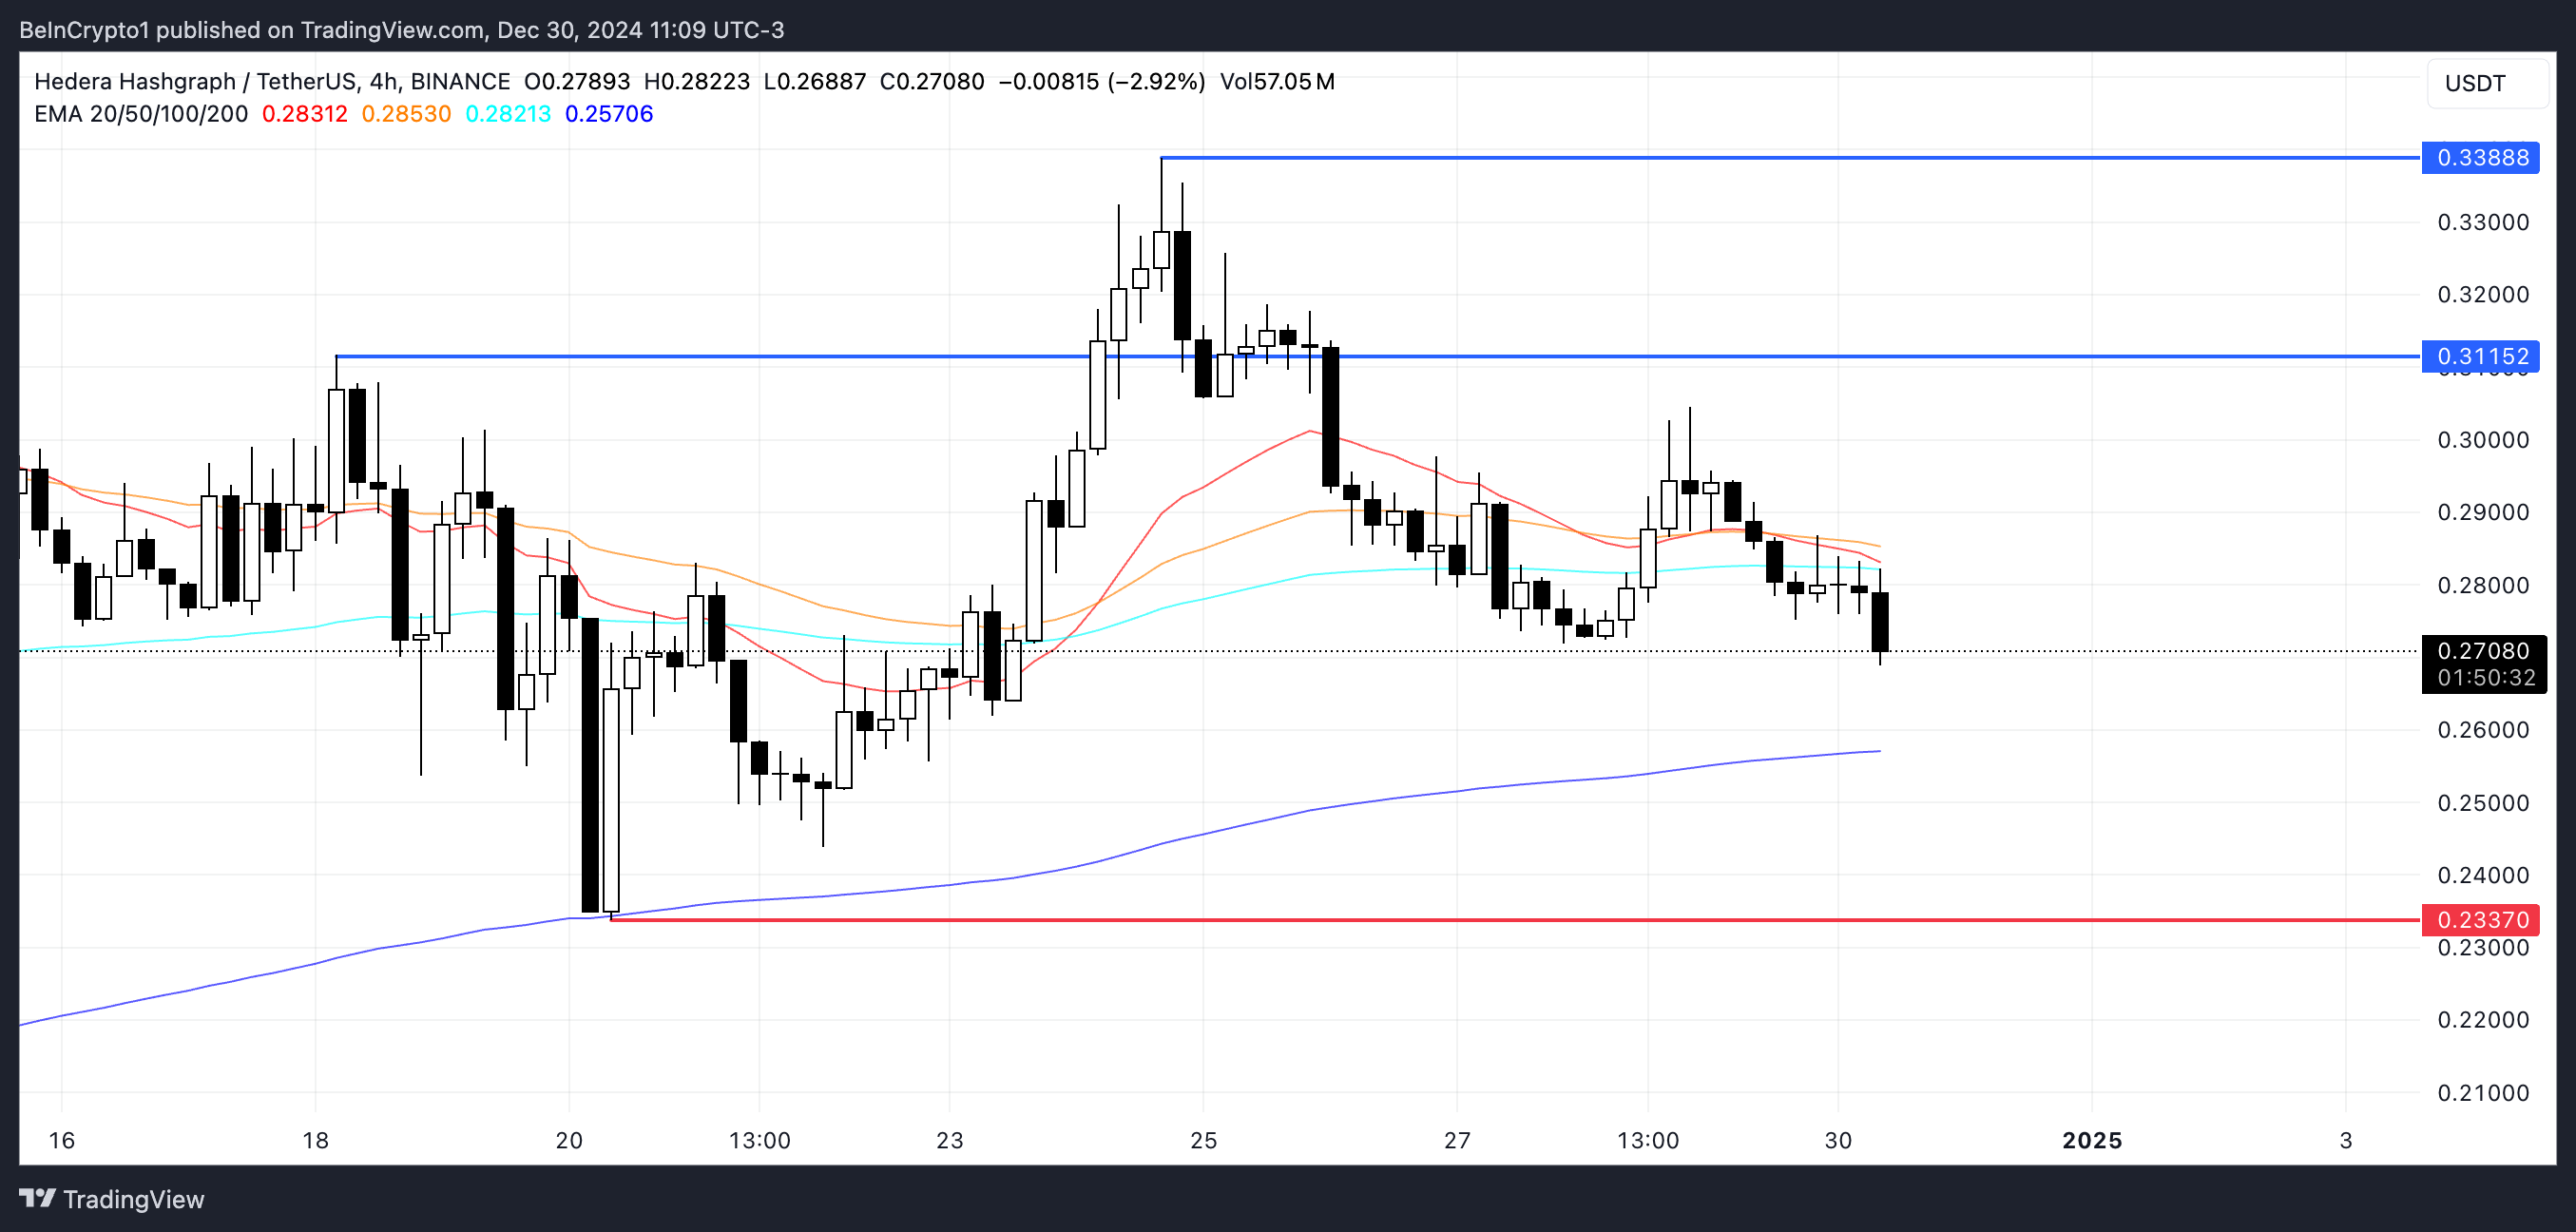
On the other hand, if the trend reverses and the short-term lines cross above the long-term ones, the HBAR price may try to recover.
In such a case, the price may test the resistance at $0.31, and a successful break above this level will pave the way for a move to $0.33. A bullish reversal of this nature indicates renewed buying interest and potential impetus for further growth.
Disclaimer
In accordance with Trust Project guidelines, this price analysis article is for informational purposes only and should not be construed as financial or investment advice. BeInCrypto is committed to accurate, unbiased reporting, but market conditions are subject to change without notice. Always do your own research and consult with a professional before making any financial decisions. Please note that our terms and conditions, privacy policy and disclaimer have been updated.


