PEPE Value Strengthens: Where’s Next?

Ready to uncover the secrets behind PEPE's recent rollercoaster ride?
Dive into this analysis to find out what key indicators reveal the market's next move and gain actionable insights to stay ahead of the game.
PEPE Daily Chart Analysis
The daily chart of PEPE/USDT shows that the price has increased dramatically. Right now, it seems to be stabilizing around 0.000014.
The base line of the Ichimoku Cloud, marked in red, sits around 0.000012, which could be an important support level. If the price falls below this line, we will see a change in market sentiment.
The two Exponential Moving Averages (EMAs) at 0.00000871 and 0.00000623 are trending upward, suggesting that the bullish momentum may continue. As long as the price stays above these EMAs, there is potential for further appreciation.
However, if the price falls below the baseline of the Ichimoku cloud and the EMAs start to flatten or decline, this may indicate that the market sentiment has turned into a bearish trend.
Read more: Pepe: A comprehensive guide to what it is and how it works
It is important to watch the 0.000012 support level closely. If the price breaks out of this level, it could be a good entry point to buy.
Analyzing PEPE on the 4-hour chart
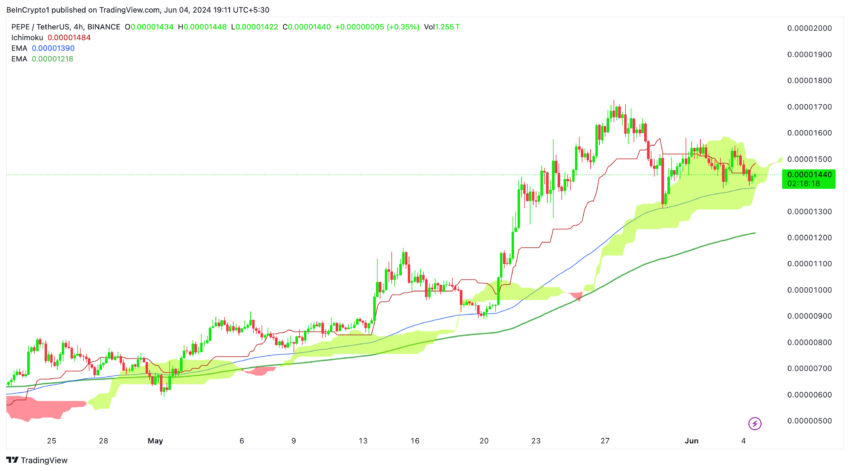
Let's examine PEPE/USDT on the 4-hour chart, focusing on key indicators: the Ichimoku Cloud baseline (in red), the 100-day Exponential Moving Average (EMA) in blue, and the 200-day EMA in green. We will also examine the current price action and what it could mean for the market.
First, PEPE has been on a journey lately. The price surged, then pulled back sharply. Even with this correction, it is still trading above critical support levels, suggesting there is still plenty of demand and potential for further gains.
Currently, PEPE is trading in the Ichimoku Cloud on the 4-hour chart, it is positioned between the baseline at 0.00001484 and the 100 EMA. This is a critical area. If the price can push above the threshold, it can rise above the cloud – a very powerful signal. Think of the starting line as a gateway: crossing it can ignite another rally.
Read More: Pepe (PEPE) Price Prediction 2024/2025/2030

The price is currently trading between the 100 EMA (0.00001390) and the 200 EMA (0.00001218). If it dips below the 100 EMA, we will see it break out of the cloud, which will be a bearish signal and may reverse the current bullish trend.
The 200 EMA will be a key support level to watch in this case. Think of the 100 EMA as a resistance train; If the price falls within it, the 200 EMA will act as a safety net below.
A transaction in the Ichimoku Cloud represents a moment of integration or decision. PEPE's current position suggests that the market is at a critical stage. Going above the cloud will ensure the continuation of bullishness, while going below can turn the mood into depression.
Strategic recommendations
For short-term traders: focus on the 4-hour chart. A breakout above the Ichimoku cloud baseline or a drop below the 100 EMA will guide your trading strategy.
For long-term investors, the daily chart provides a broader perspective. Monitoring the EMAs and the 0.000012 support level will help them make informed decisions.
Disclaimer
In accordance with Trust Project guidelines, this price analysis article is for informational purposes only and should not be construed as financial or investment advice. BeInCrypto is committed to accurate, unbiased reporting, but market conditions are subject to change without notice. Always do your own research and consult with a professional before making any financial decisions. Please note that our terms and conditions, privacy policies and disclaimers have been updated.


