SOL price expects a directional breakout after weak trends.

Solana (SOL) has been consolidating in recent days, posting a 2.7% decline over the past week. Indicators such as BBTrend and DMI reflect weak progress, with BBTrend slightly positive at 0.14 and ADX at a low of 12, indicating an unclear trend.
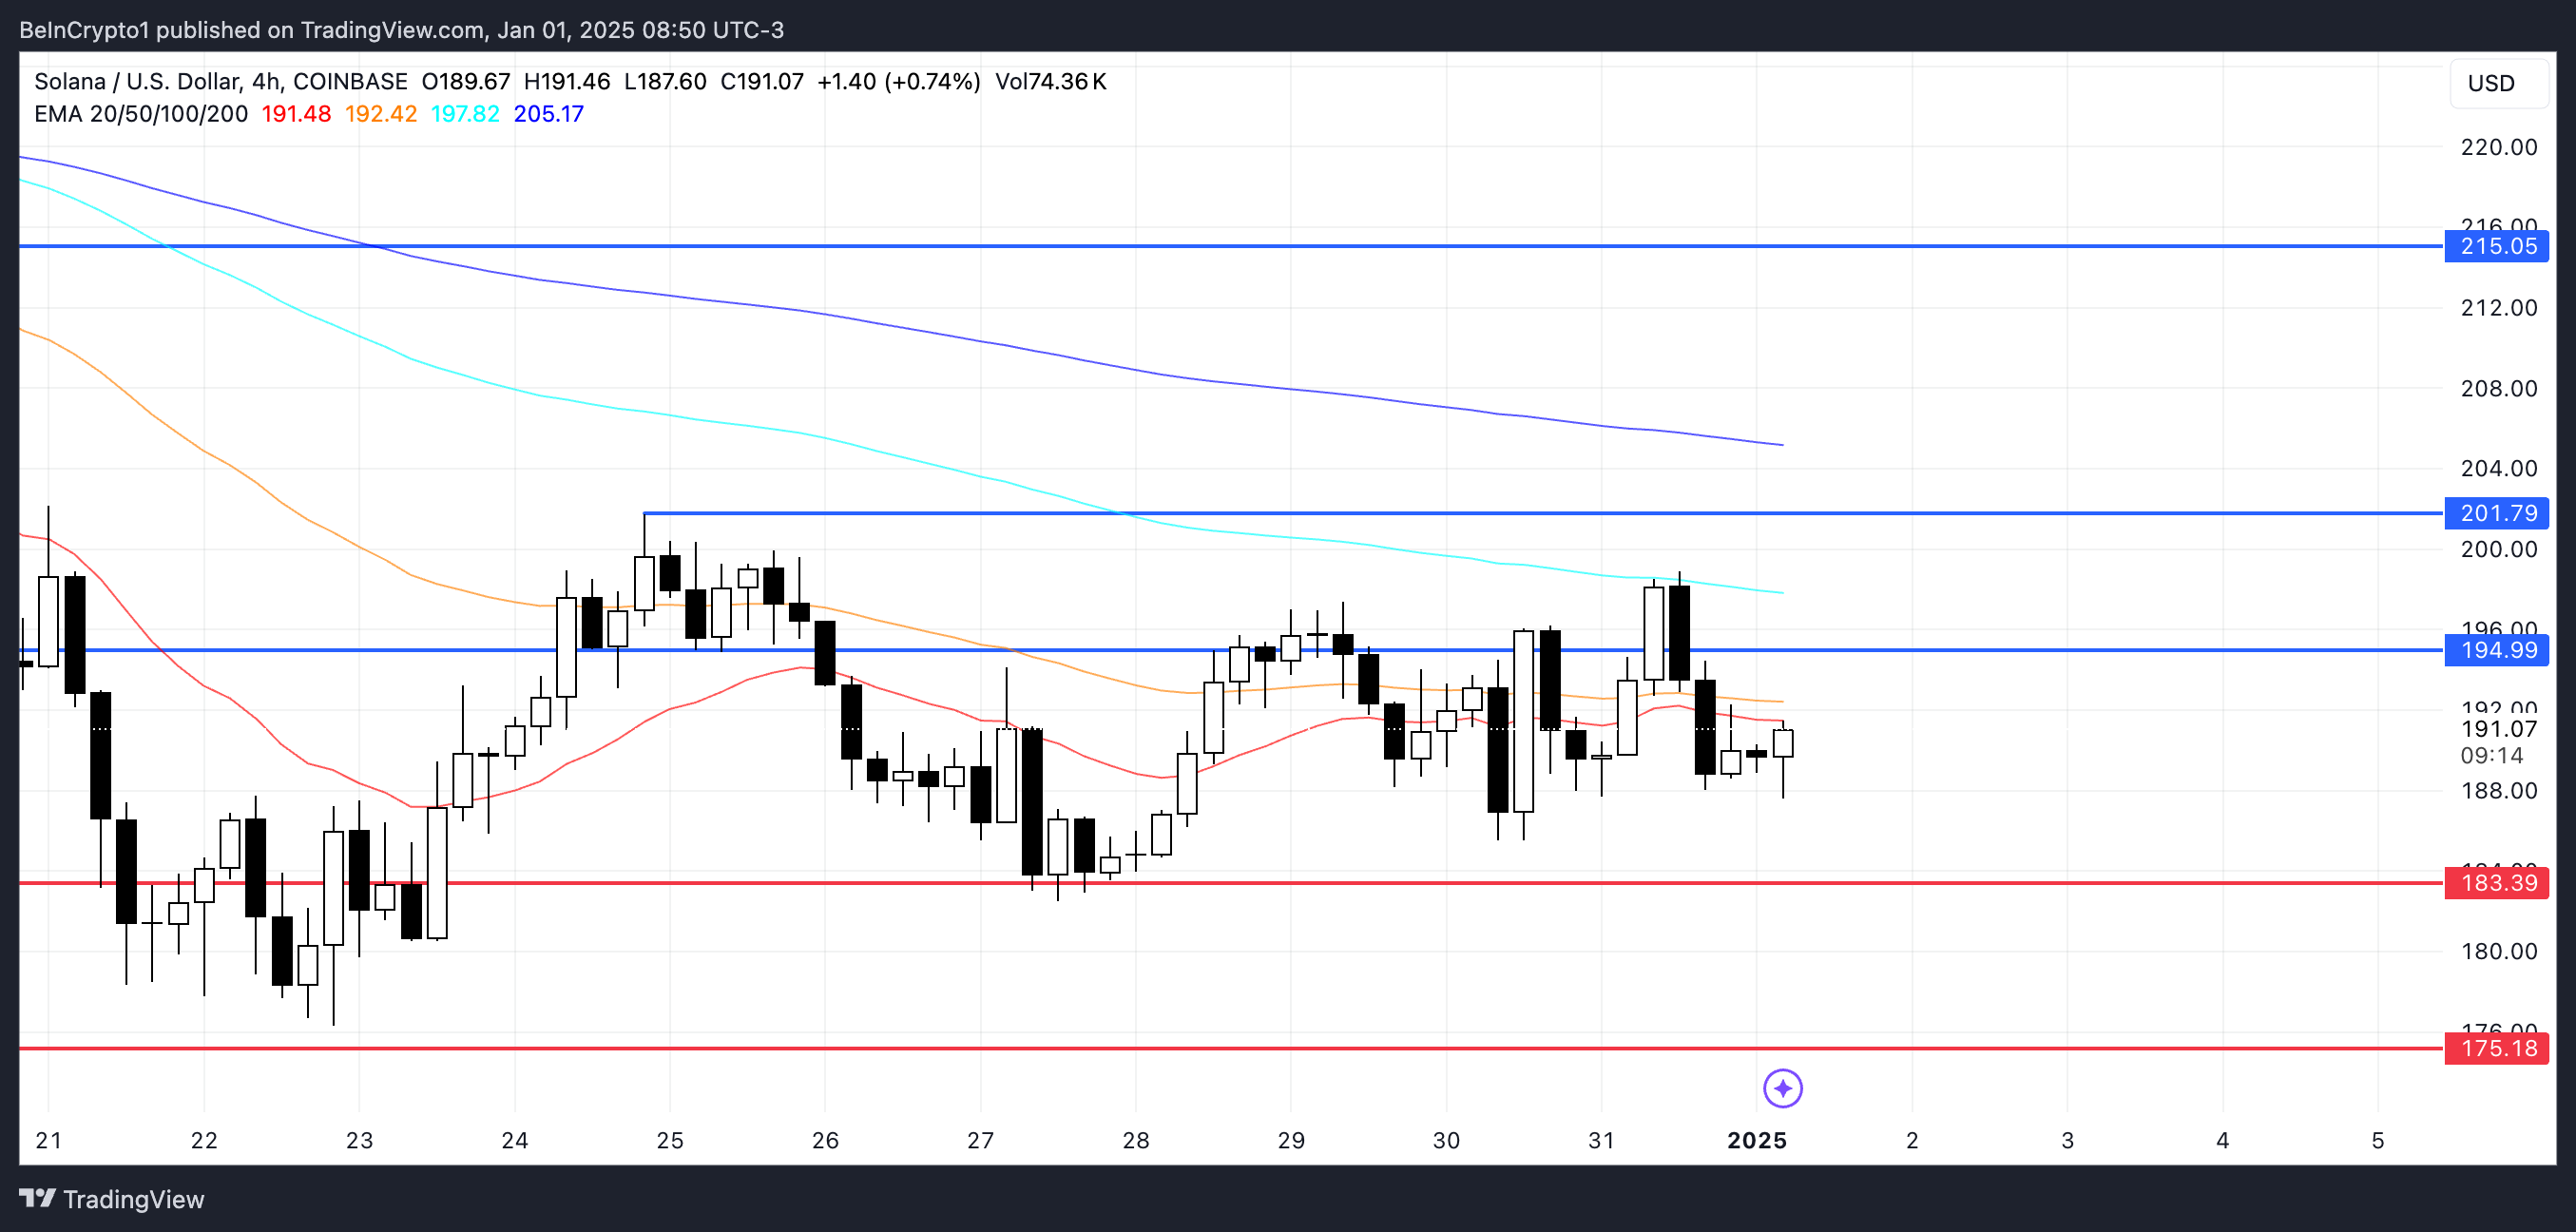
SOL's EMA lines indicate a bearish position, although the absence of a strong downtrend indicates stability. Key levels at $183 support and $194 resistance may determine whether the SOL continues to strengthen or take a decisive move in the near term.
SOL BBTrend is not strong yet.
Solana BBTrend is currently at 0.14, which shows a moderate positive outlook as it tries to reach higher levels. Over the past few days, BBTrend has been stable, fluctuating between 0 and 1.08, suggesting limited momentum in both directions.
While the indicator's positive value indicates a recovery from the negative levels seen between December 21 and December 26, the lack of significant upward movement indicates that the SOL is struggling to build the momentum necessary for a strong rally.
Derived from Bollinger Bands, BBTrend measures the strength and direction of a trend. Positive values indicate upward acceleration, and negative values indicate downward acceleration. Although the Solana BBTrend is no longer in negative territory, the low positive reading around 0.14 reflects a weak market environment.
This suggests that while selling pressure is easing, there is not enough buying activity to cause a significant breakout, keeping the SOL price in a cautious consolidation process. Further movement in BBTrend is necessary to confirm any significant price action.
Solana is stuck on integration.
Solana's DMI chart shows the ADX now at 12, remaining below 20 since December 30, indicating weak trend strength. This low ADX reading indicates that the current bearish trend has no significant revival, indicating a bullish market condition.
With both directional indicators (D+ and D-) relatively close, the chart shows no clear dominance, although D- is slightly higher at 18.8 than D+ at 16, maintaining a bearish bias.

The Average Directional Index (ADX) measures the strength of a trend on a scale of 0 to 100, regardless of direction. Values above 25 indicate a strong trend, while readings below 20, such as SOL current 12, indicate weak or non-existent trends.
In the short term, this combination of a low ADX and slightly dominant D- suggests that Solana is in a consolidation phase, with the downtrend losing momentum but not yet reversed.
SOL Price Prediction: More lateral movements in the future
EMA lines indicate a general bearish setup for Solana prices, with the long-term lines sitting above the short-term, reflecting downward momentum. However, as indicated by the DMI chart and BBTrend, there is currently no strong trend driving the SOL price action, which is consistent with its consolidating nature.
If the downward trend is strengthened, the price of SOL may test the support at $183, and failure to hold this level may cause the price to rise to $175, indicating an increase in bearish pressure.

On the contrary, if the price of SOL finds its momentum and rises, it can challenge the resistance at $194.
A break above this level could lead to a test of the next resistance at $201, which could further rise to $215 if the barrier is broken.
Disclaimer
In accordance with Trust Project guidelines, this price analysis article is for informational purposes only and should not be construed as financial or investment advice. BeInCrypto is committed to accurate, unbiased reporting, but market conditions are subject to change without notice. Always do your own research and consult with a professional before making any financial decisions. Please note that our terms and conditions, privacy policies and disclaimers have been updated.


