Solana evaluates the chances of hitting $85

Solana's (SOL) price continues to undergo a correction process, leading to speculation about further declines or potential upside.
Initially, Solana showed a rebound from the golden ratio support around $125. But contrary to expectations to ease the correction direction, the price seems to be falling further.
Tracking Solana: A brief history of SOL price developments
After hitting highs around $209, Solana experienced a major correction near $162.5, indicating the beginning of a correction phase. Subsequently, the formation of a low high confirmed the continuation of the corrective movement.
Following a breakout from golden ratio support around $125, Solana briefly rose to the 50-day EMA at $155, but faced resistance and another correction period. Currently, Solana finds prominent Fibonacci support around $143.
A possible rebound from this support level could lead Solana to retest the 50-day EMA at $155, with further upside potential towards the golden ratio around $175. However, the uptrend will need a critical breakthrough above the resistance of the golden ratio to resume.
Read more: 11 best Solana meme coins to watch in 2024
Conversely, a breach of the .382 Fib support at approximately $143 could see Solana return to the golden ratio support at $125. Further downside momentum could target the 200-day EMA around $111.
On the daily chart, the MACD histogram reflects a recent bearish trend, while the MACD lines hover together, indicating the possibility of bullish and bearish breakouts. Meanwhile, the RSI remains neutral, and the presence of a golden cross over the EMAs indicates a sustained bullish outlook in the short to medium term.
Death cross forms on the Solana 4H chart
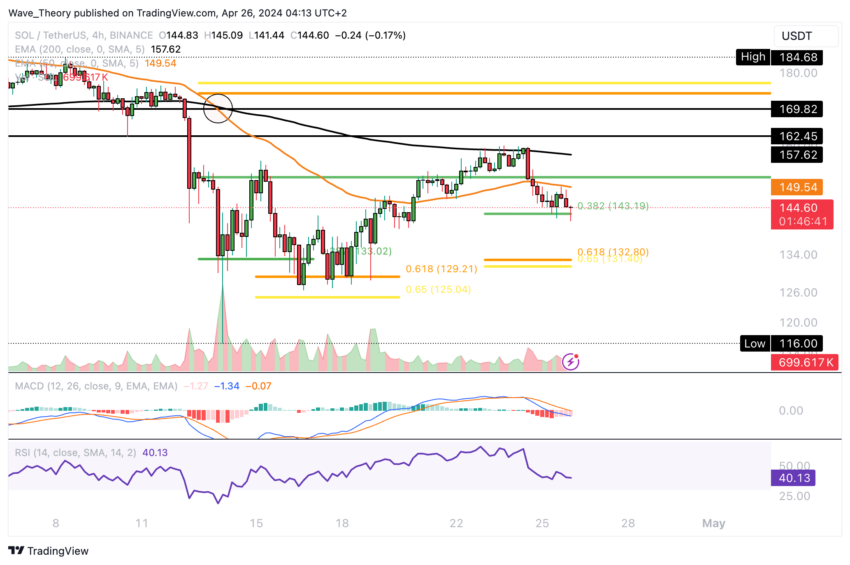
For Solana in the 4-hour chart, the formation of a death cross on the EMAs indicates a confirmed bearish trend in the short term. Additionally, a crossover of the MACD lines, coupled with a neutral position of the RSI, further supports this sentiment.
Despite these signs, the MACD histogram shows a bullish trend, indicating the possibility of an upward move in the near term. Solana may find support at the .382 Fib level at approximately $143, which may target the 50-4H EMA around $149.5.

However, recent bearish rejections at this level highlight the challenges Solana faces in its current price action.
Why Solana is down 45%: Reasons behind the steep decline
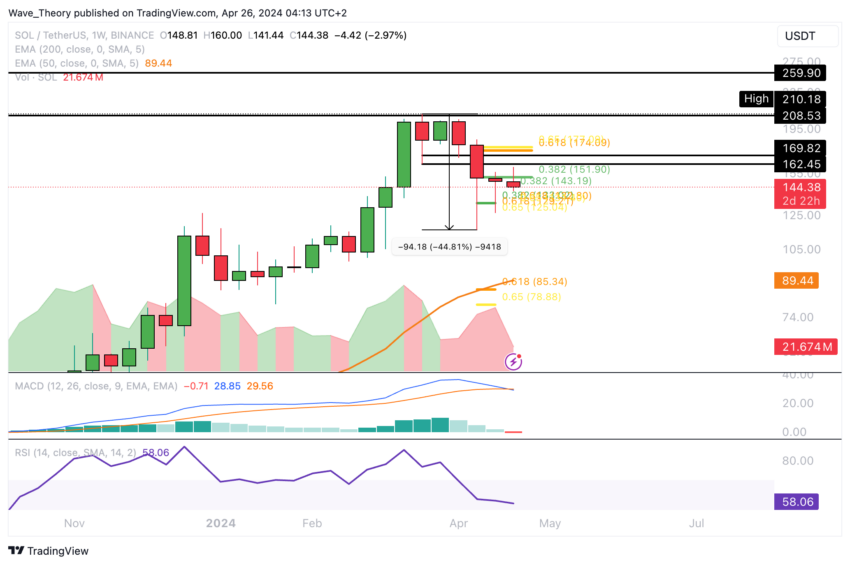
In the last six weeks, the price of Solana has adjusted by more than 45%. If this correction level continues, significant support is expected for SOL between $79 and $89.5. This range coincides with the intersection of the 50-week EMA and critical golden ratio support.
Keeping Solana's price above the golden ratio threshold at $85 is critical to maintaining the bullish direction. However, insights from the weekly chart paint a murky picture. The MACD lines are currently at a hidden cross, while the MACD histogram shows a downward trend.

At the same time, RSI remains neutral with no clear bullish or bearish signs.
Bearish signals: MACD histogram ticks lower on the monthly chart
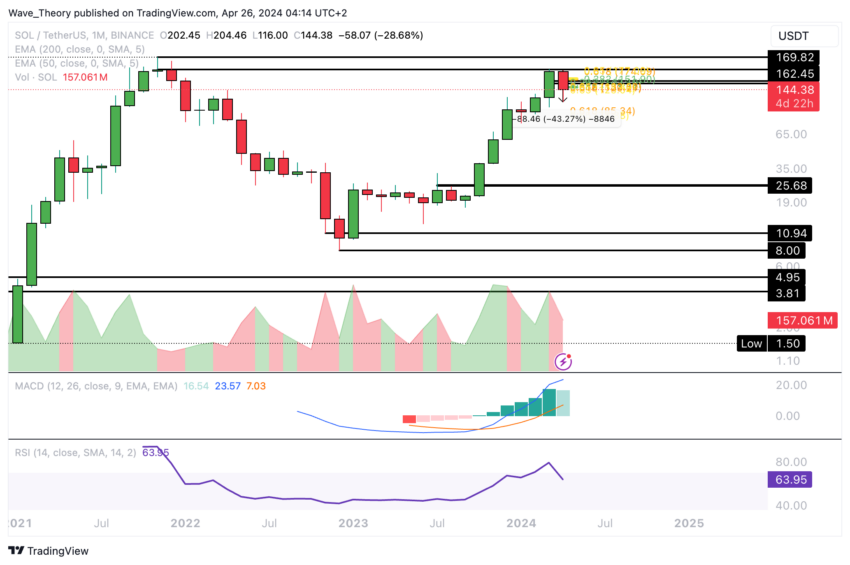
The current month has seen a price drop of approximately 43.3 percent. This decline is reflected in the MACD histogram, which now shows a bearish trend.

However, on the monthly chart, the MACD lines remain in a bullish crossover, indicating continued bullishness. Additionally, the RSI has returned to neutral territory, indicating a possible stability in market sentiment.
Solana vs. Bitcoin: Expecting bullish rebound from Fib support
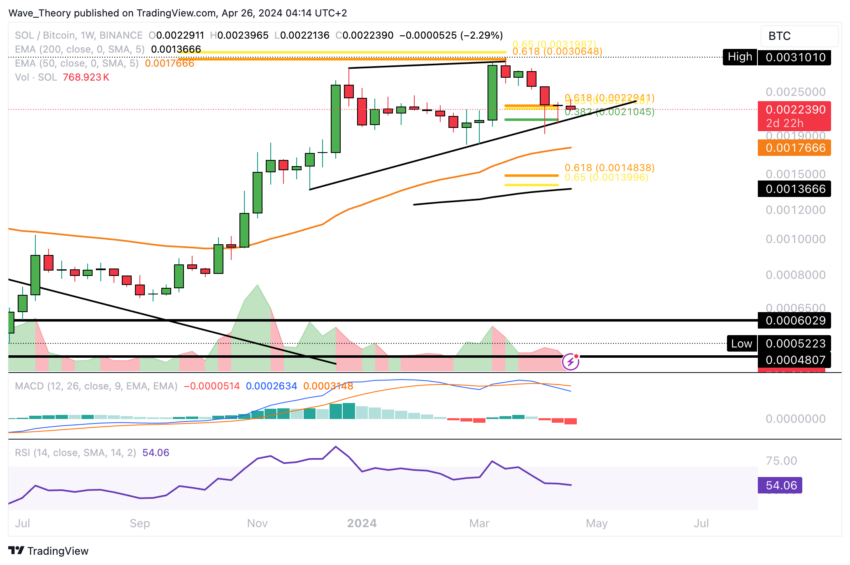
On Bitcoin, Solana currently supports itself in the range of 0.0021 BTC to 0.0023 BTC. This provides an opportunity for energy restoration.
However, on the weekly chart, it is important to note that the MACD lines have crossed passively and the MACD histogram is showing a downward trend, indicating bearish sentiment. At the same time, RSI remains in the neutral range, lacking clear signs of bullishness or bearishness.
Read More: Solana (SOL) Price Prediction 2024/2025/2030

In the event of a bearish trend, Solana may encounter significant Fib support around 0.00145 BTC. Before that, further support is expected around the 50-week EMA around 0.001766 BTC.
Disclaimer
In accordance with Trust Project guidelines, this price analysis article is for informational purposes only and should not be construed as financial or investment advice. BeInCrypto is committed to accurate, unbiased reporting, but market conditions are subject to change without notice. Always do your own research and consult with a professional before making any financial decisions. Please note that our terms and conditions, privacy policy and disclaimer have been updated.


