Why $211 support is critical.

The price of Solana (SOL) has increased by 9% in the last seven days, bringing the market value to over $100 billion and currently sits at $103 billion. Despite this growth, SOL's trading volume decreased by 34% in the last 24 hours, at $2.4 billion.
Positive indicators such as its CMF and recent Golden Cross support the momentum. However, whether SOL can continue its upward trend or face a correction will depend on holding the crucial $211 support level.
Solana CMF is still high but shows a fall from its highs
Solana's Chaikin Cash Flow (CMF) is currently at 0.23, indicating a positive capital flow in the property. CMF measures the cash flow to an asset over a period of time based on value and volume. Values above 0 indicate net buying pressure, values below 0 indicate net selling pressure.
The SOL CMF rose to 0.33 on Jan 1 from about 0 yesterday, indicating strong buying momentum in this period.
At 0.23, SOL CMF remains in positive territory, which indicates continued buying interest, although it has decreased slightly compared to the recent high. This 0.33 decline could suggest that buying pressure has cooled slightly, which could indicate a period of consolidation or a slow upward movement for the price.
For SOL to maintain its bullish trajectory, the CMF should stabilize or rebound, indicating renewed confidence among investors. However, the continued decline may indicate a weakening of demand, increasing the possibility of a price correction in the short term.
SOL sellers show signs of recovery
SOL's Average Directional Index (ADX) rose to 45, a sharp rise from 10.8 four days ago, indicating the formation of a strong trend. The ADX measures the strength of a trend from 0 to 100, with values above 25 indicating a strong trend and values below 20 indicating a weak or absent trend.
This high increase in ADX confirms that SOL is currently in strong growth, indicating strong market activity and confidence in the price direction.

Directional indicators provide additional insight into current trends. + DI, which represents buying pressure, is at 27.5, although it has decreased from 35.8 yesterday, which indicates a slight decrease in bullishness. Meanwhile, -DI, which indicates selling pressure, increased from 8.6 to 12.6, indicating that bearish activity has increased slightly.
Despite these shifts, the breakout remains intact as +DI supported by strong ADX is still significantly higher than -DI. However, Solana's declining +DI suggests that the bullish momentum may be stable, and the market may enter a consolidation phase unless the bullish momentum prevails.
SOL Price Prediction: Could it bounce back to $246 soon?
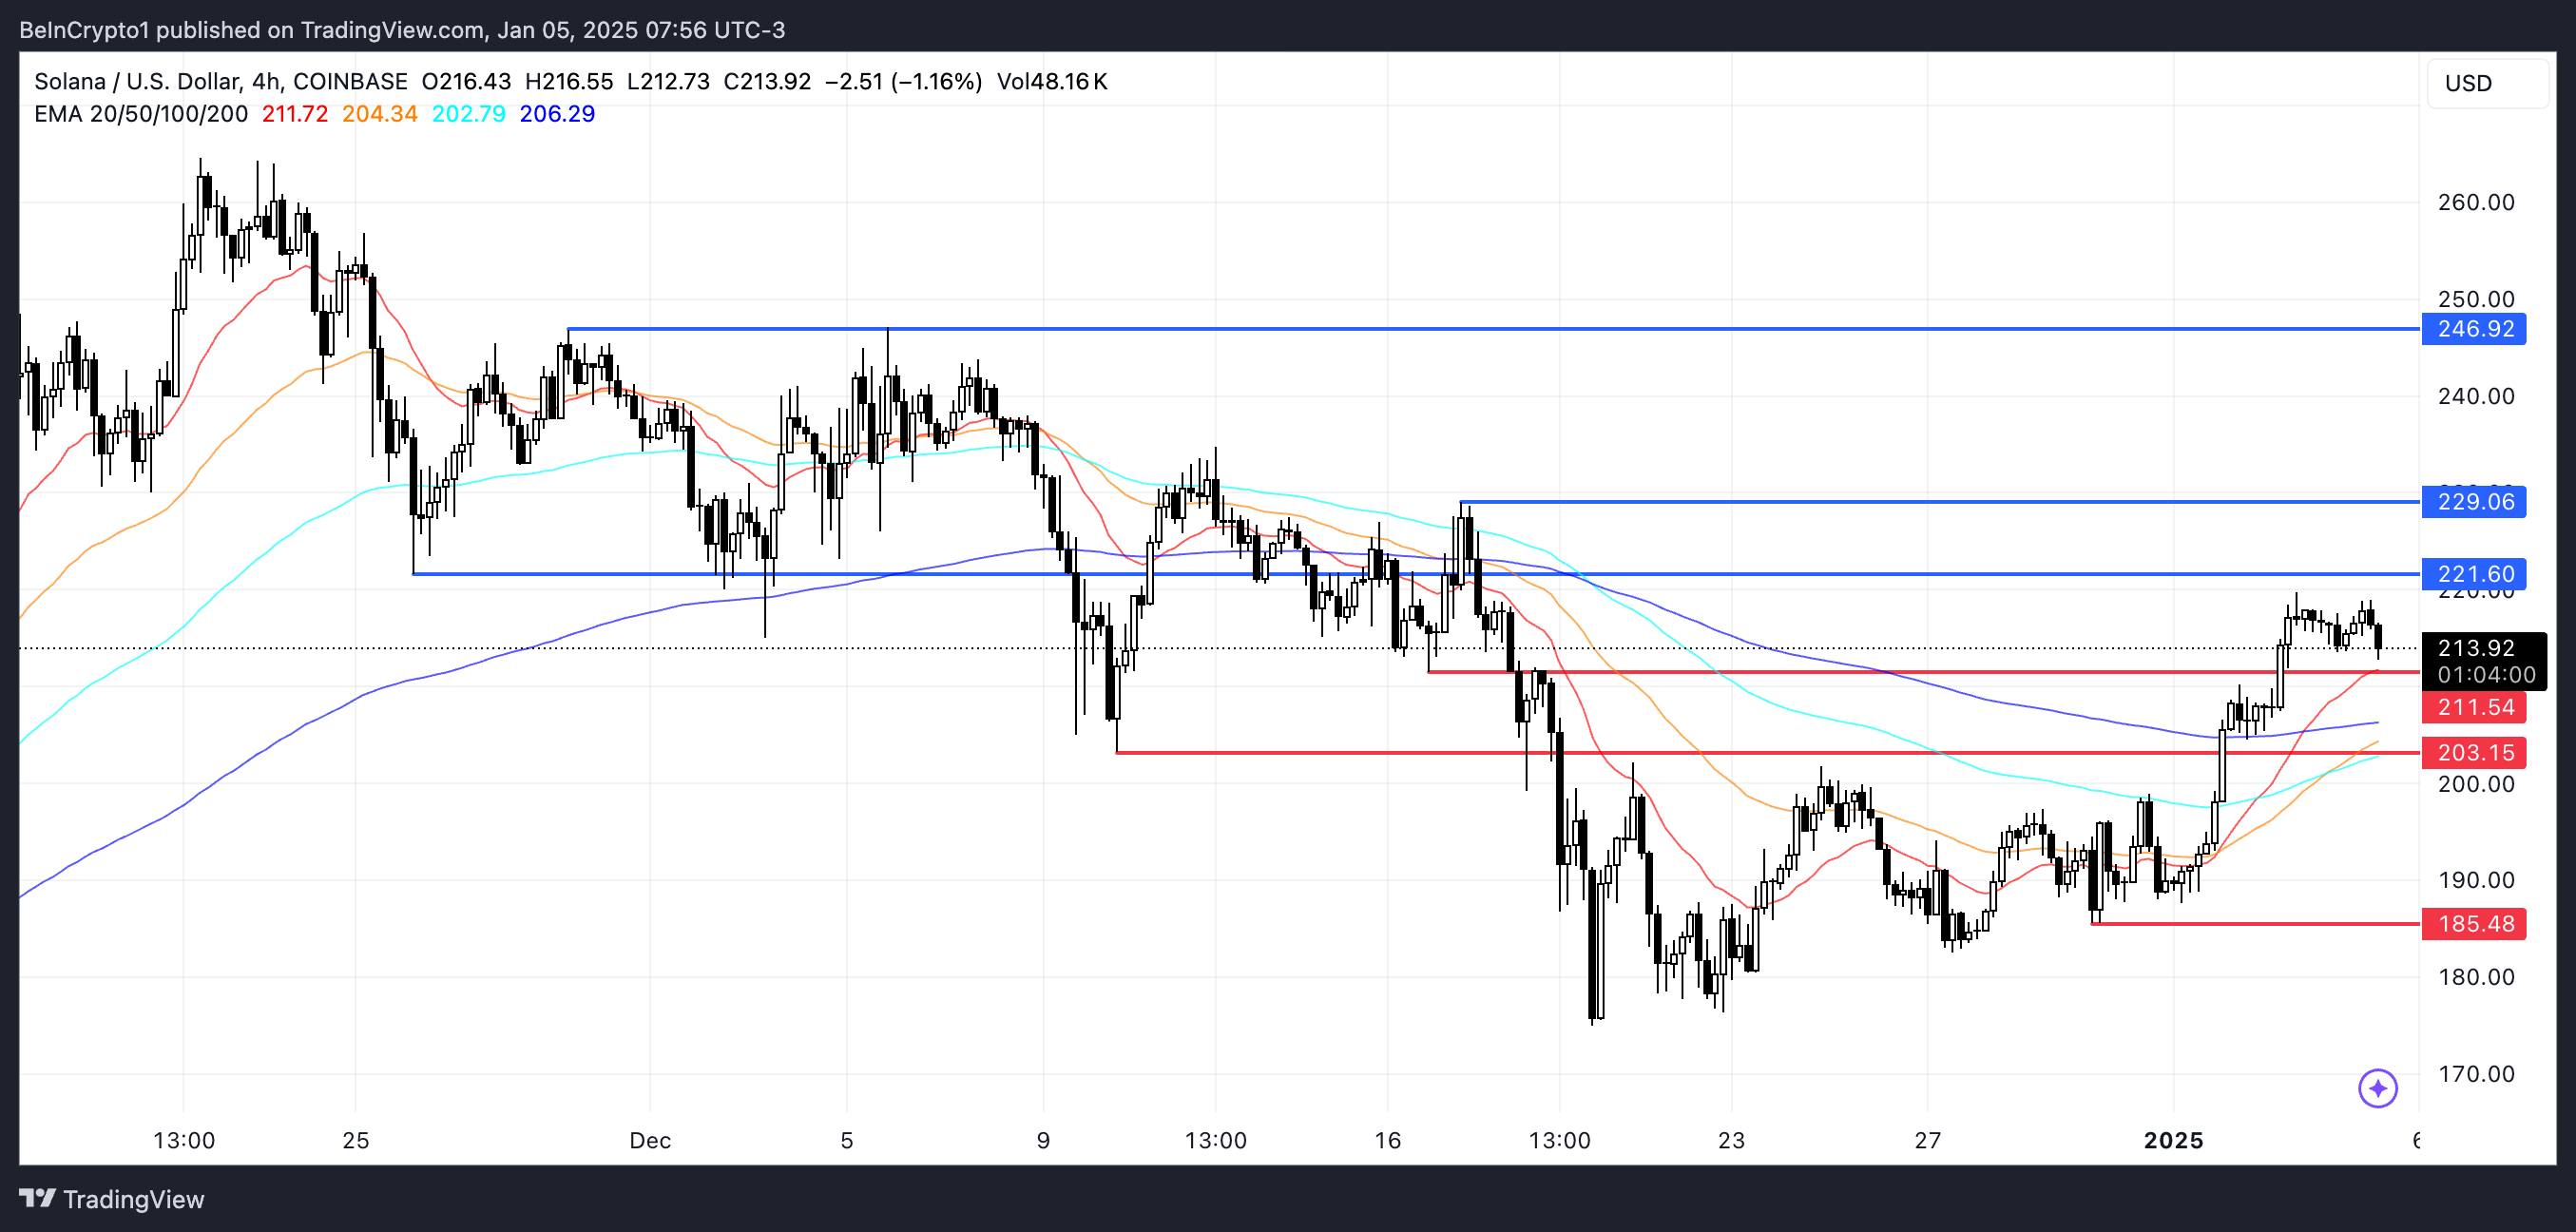
Solana's price action hinges on whether it can sustain the crucial $211 support level. If this support is lost, SOL could enter a downtrend, with $203 as the next key level to watch.
Failure to hold above $203 could accelerate the decline, pushing the price towards $185, signaling a significant change in sentiment.

In contrast, the AMA lines remain bullish, indicating optimism for an upward move. A golden cross was formed two days ago, reinforcing the ongoing motivation.
If it holds support at $211, the price of SOL may rise to challenge the resistance at $221. Passing this level can pave the way for an additional profit of up to $229. If the momentum of the bull is strengthened, the price of Solana may reach $246, which is an increase of 16% from the current level.
Disclaimer
In accordance with Trust Project guidelines, this price analysis article is for informational purposes only and should not be considered financial or investment advice. BeInCrypto is committed to accurate, unbiased reporting, but market conditions are subject to change without notice. Always do your own research and consult with a professional before making any financial decisions. Please note that our terms and conditions, privacy policy and disclaimer have been updated.


