Why Bitcoin (BTC) May Be on the Verge of a Major Bull Run

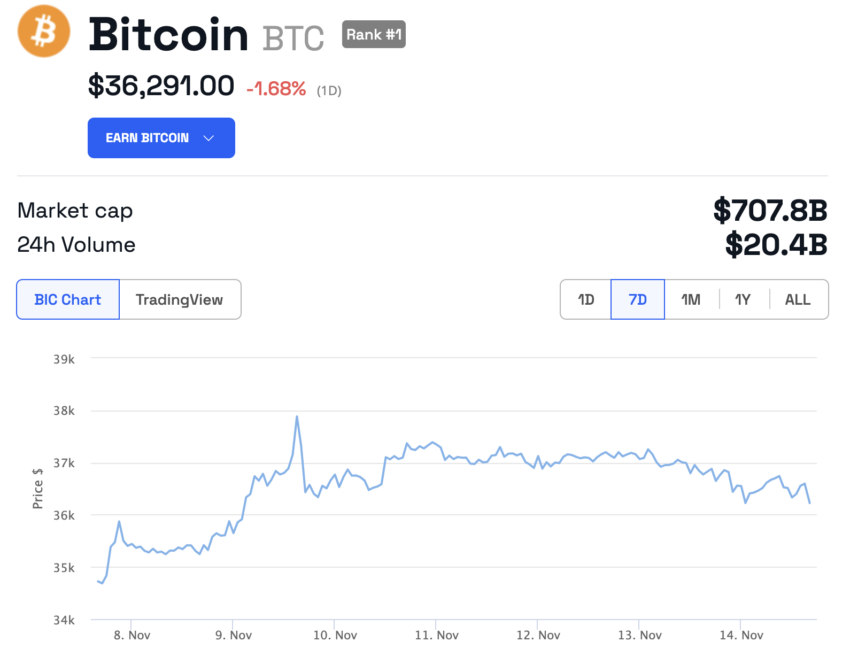
On November 12, Bitcoin (BTC) hit an 18-month high of $37,000. The rise comes amid rising hopes that US regulators will soon approve a bitcoin exchange-traded fund (ETF), one analyst said, leading to the next bull run.
Market analysts looking at historical data suggest that the approval of the ETF could lead to a further increase in the value of the asset. A researcher on social media platform X (formerly Twitter) suggests that this price increase could be the biggest Bitcoin bull market yet.
Bitcoin close to the biggest bull run in history
Cryptocurrency analyst el_crypto_prof has suggested on X that Bitcoin is on the cusp of its “biggest bull run of all time.” According to the expert, Bitcoin recently flashed a rare buy signal, which was last seen eight years ago. The signal can be read on the chart using a long time.
Read More: How To Read Crypto Charts Guide
Bitcoin rose above the 20-day simple moving average (SMA) line, which the expert called an important level. These mechanics suggest that Bitcoin may soon enter a major bull market.
Read more: What is Technical Analysis? Everything you need to know
Recorded growth can be boosted by Bitcoin ETFs.
The positive signs come at a surprising time for Bitcoin as it looks set to hit a historic high in an environment of regulatory uncertainty.
The recent price volatility can be attributed to 12 Bitcoin spot ETFs. The latest odds predict a chance of approving the applications within the next week.
Bloomberg ETF analysts James Seifert and Eric Balchunas noted that the US Securities and Exchange Commission (SEC) has until November 17 to review and approve applications from prominent fund managers. Investors are focusing on the ETF approval by the world's largest investment company, BlackRock. However, skeptics say an ETF approval does not guarantee a bull market.
Bitcoin (BTC) price analysis
Bitcoin is currently trading around $36,134, and is down 1.8% in the last 24 hours. In the last seven days, the price has increased by 3.8%.

Technical indicators on TradingView forecast are pessimistic for Bitcoin. The summary indicator is pointing “Buy”, while the moving average indicator is flashing a more bullish “Strong Buy” signal.

Currently, Bitcoin appears to be sitting above $35,000. The crypto community is now focusing on the $40,000 resistance level.
All of these suggest that Bitcoin's biggest rally could be coming soon. Investors are eagerly awaiting the SEC's decision on ETF approvals, which could lead to further losses.
Do you have anything to say about whether these signals point to a Bitcoin bull market after ETF approval or something else? Please write to us or join the conversation on our Telegram channel. You can also find us on TikTok, Facebook or X (Twitter).
Disclaimer
Adhering to the Trust Project guidelines, BeInCrypto is committed to unbiased, transparent reporting. This news report aims to provide accurate and up-to-date information. However, readers are advised to independently verify facts and consult with professionals before making any decisions based on this content.


